

Ruby Mills Q1 EBITDA jumps 134% to ₹255M; profit dips 2%


Ruby Mills Limited reported a Q1FY26 standalone net profit of ₹118.25 lakh, down 1.9% YoY. However, operational strength was evident with EBITDA jumping 134% to ₹255 million and margins expanding to 27.90%. Revenue grew 31.5% to ₹915 million, driven by real estate.


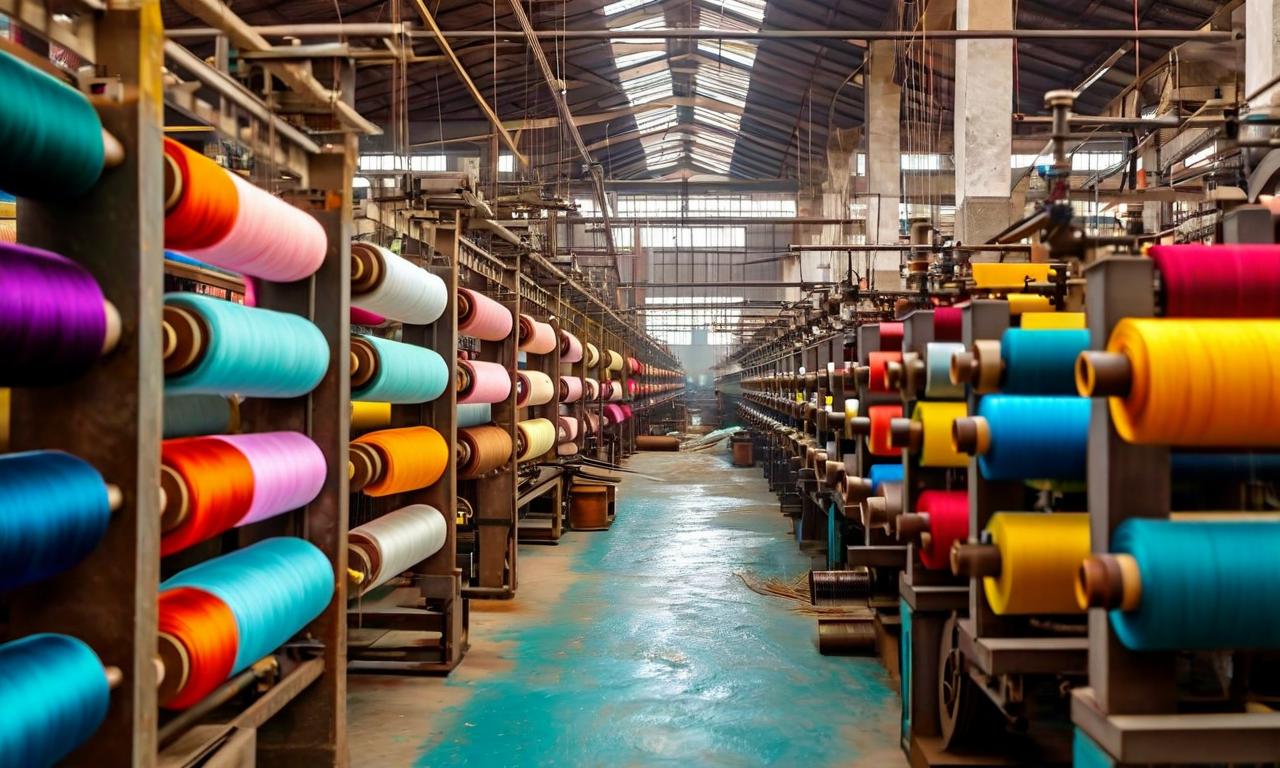
*this image is generated using AI for illustrative purposes only.
The Ruby Mills Limited reported a standalone net profit of ₹118.25 lakh for the quarter ended June 30, 2026 (Q1FY26), marking a 1.9% decline year-on-year from ₹120.59 lakh. While the bottom line contracted slightly due to higher tax provisions, the company’s operational efficiency improved markedly. EBITDA surged to ₹255 million (₹25.5 crore) in Q1FY26, compared to ₹109 million (₹10.9 crore) in the corresponding period last year. This represents a 134% increase, driving the EBITDA margin up to 27.90% from 15.71% in Q1FY25.
Revenue from operations expanded significantly by 31.5% to ₹914.82 lakh (approx ₹915 million), compared to ₹695.73 lakh (approx ₹696 million) in Q1FY25. The company’s Board of Directors approved the unaudited financial results on August 12, 2026.
Consolidated net profit stood at ₹117.01 lakh for the quarter, up from ₹110.47 lakh in the corresponding period last year. The consolidated earnings per share (EPS) was ₹3.50, compared to ₹3.61 in Q1FY25.
Financial Performance
Standalone revenue from operations reached ₹914.82 lakh in Q1FY26, driven primarily by growth in the real estate segment. Real estate revenue contributed ₹339.26 lakh, a substantial increase from ₹101.70 lakh in Q1FY25. Textile revenue was ₹575.56 lakh, slightly down from ₹594.02 lakh in the prior year period.
| Metric | Q1FY26 | Q1FY25 | Change |
|---|---|---|---|
| Revenue from Operations | ₹914.82 lakh | ₹695.73 lakh | +31.5% |
| Net Profit (Standalone) | ₹118.25 lakh | ₹120.59 lakh | -1.9% |
| EPS (Basic & Diluted) | ₹3.54 | ₹3.61 | -1.9% |
| EBITDA | ₹255 million | ₹109 million | +134% |
| EBITDA Margin | 27.90% | 15.71% | +12.19 pts |
Profit before tax remained flat at ₹163.21 lakh, matching the ₹163.06 lakh recorded in Q1FY25. However, tax expenses increased significantly due to higher deferred tax provisions, which rose to ₹449.59 lakh from ₹4.67 lakh in Q1FY25. Current tax was nil for the quarter.
Segment Analysis
The real estate segment saw segment results rise to ₹85.14 lakh from ₹86.31 lakh in Q1FY25. The textiles segment reported segment results of ₹19.86 lakh, marginally up from ₹18.23 lakh. Capital employed across all segments increased to ₹6,851.12 lakh as of June 30, 2026, from ₹6,489.17 lakh a year earlier. This reflects continued investment in assets, particularly in the real estate division where segment assets rose to ₹8,013.38 lakh.
What the Numbers Show
A key divergence in the results is the surge in other income, which jumped to ₹135.68 lakh in Q1FY26 from ₹90.16 lakh in Q1FY25. This represents a 50.5% increase and accounts for approximately 13% of total income. While operational revenue grew steadily, this spike in non-operating income helped cushion the impact of rising finance costs, which increased to ₹98.83 lakh from ₹9.37 lakh in the prior year period. The high finance cost suggests increased leverage or new debt obligations impacting the bottom line despite stable operating profits. The significant expansion in EBITDA margin to 27.90% highlights improved core operational profitability, even as net profit dipped due to tax and finance cost pressures.
Historical Stock Returns for Ruby Mills
| 1 Day | 5 Days | 1 Month | 6 Months | 1 Year | 5 Years |
|---|---|---|---|---|---|
| -4.35% | +1.55% | +13.76% | +127.27% | +131.75% | +255.56% |

Will the significant increase in deferred tax provisions persist in subsequent quarters, or is this a one-time accounting adjustment?
How does the sharp rise in finance costs to ₹98.83 lakh impact the company's debt servicing capacity and future capital allocation plans?
Can the real estate segment sustain its revenue growth trajectory given the substantial increase in segment assets and capital employed?
 16
16







 Create Custom Screeners
  Access 200+ Pre-built Filters
  Use 50+ Readymade Screener





