

AMD shares rise 2.7% in premarket as Nasdaq futures gain


- AMD shares rose 2.71% to $469.10 in premarket trading on Tuesday
- Nasdaq futures gained 0.96%, driving broader risk-on sentiment
- Stock trades at a P/E ratio of 116.5 with an average price target of $595.91
- Technical analysis shows short-term pressure below 20-day and 50-day SMAs
- Major ETFs including SOXX and ARKW hold significant AMD weightings



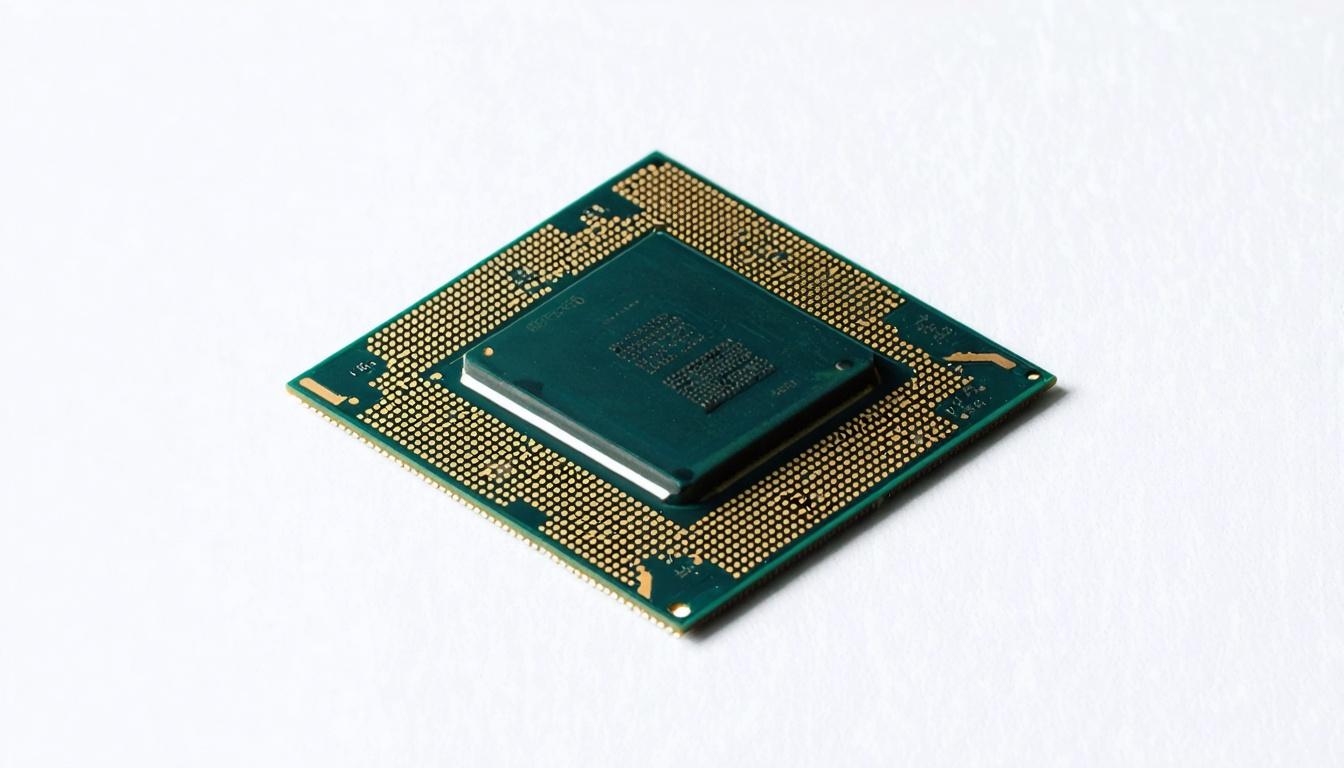
*this image is generated using AI for illustrative purposes only.
Advanced Micro Devices Inc. (NASDAQ: AMD) shares rose 2.71% to $469.10 in Tuesday’s premarket trading. The stock’s early gain mirrored a broader risk-on sentiment, with Nasdaq futures up 0.96% and S&P 500 futures rising 0.46%.
The price action appears driven by general market momentum rather than company-specific news. Investors are focusing on AMD’s chart setup and recent analyst support, particularly given the stock’s exposure to artificial intelligence growth narratives.
Technical Analysis
AMD remains under short-term pressure but maintains a longer-term bullish structure. Key technical levels include:
| Metric | Status | Value/Level |
|---|---|---|
| 20-day SMA | Below by | 1.8% |
| 50-day SMA | Below by | 7.6% |
| 100-day SMA | Above by | 5.8% |
| 200-day SMA | Above by | 42.3% |
The stock trades below its 20-day simple moving average (SMA) and 50-day SMA, indicating a near-term pullback. The 20-day SMA sits below the 50-day SMA, a bearish short-term signal. However, the 50-day SMA remains above the 200-day SMA, supporting the broader uptrend.
Momentum indicators show cooling strength. The Moving Average Convergence Divergence (MACD) is below its signal line with a negative histogram, suggesting the recent rally has lost some force.
Traders are monitoring support near $463. A break below this level could invite further selling. Resistance is positioned near $517.50, close to the 50-day SMA area around $509.60.
Analyst Outlook
AMD trades at a price-to-earnings ratio of 116.5, reflecting a premium valuation for growth. The stock carries a Buy rating with an average price forecast of $595.91.
Recent analyst actions include:
- Raymond James upgraded AMD to Strong Buy and raised its price forecast to $641 on Aug. 25.
- BMO Capital initiated coverage with an Outperform rating and a $550 price forecast on Aug. 21.
- Argus Research maintained a Buy rating and raised its price forecast to $625 on Aug. 6.
ETF Exposure
AMD holds significant weight in several major exchange-traded funds, which can amplify buying or selling pressure based on fund flows:
| ETF | Ticker | Weighting |
|---|---|---|
| iShares Semiconductor ETF | SOXX | 8.10% |
| ARK Next Generation Internet ETF | ARKW | 8.31% |
| CoreValues America First Technology ETF | USMD | 7.74% |
What the Numbers Show
AMD presents a divergence between high growth expectations and weak value metrics. While Benzinga Edge scores highlight strong Momentum, Growth, and Quality, the Value score remains weak. This profile suggests that while buyers may defend the stock due to AI upside and trend strength, the high P/E ratio of 116.5 implies limited margin for error if momentum fades.

How might AMD's high P/E ratio of 116.5 impact investor sentiment if the broader AI growth narrative slows down in the next quarter?
What specific catalysts are needed for AMD to break through the $517.50 resistance level and retest the 50-day SMA?
Could significant outflows from major ETFs like SOXX or ARKW trigger a breakdown below the critical $463 support level despite analyst upgrades?
 16
16














 Access 50+ Readymade Screeners
  Use 200+ Custom Filters
  Get Full Market Insights





