
 NewsSynergy Green Industries Files Revised FY2025-26 Annual Report to Correct Typographical Errors
Synergy Green Industries Files Revised FY2025-26 Annual Report to Correct Typographical Errors


Synergy Green Industries filed a revised Annual Report for FY2025-26 with BSE and NSE to correct typographical errors that do not affect financial statements. The company reported total income of ₹37,637.36 Lakhs, profit after tax of ₹465.83 Lakhs, and EPS of ₹3.00, while completing a transformational ₹217 crore capex programme. The 16th AGM is scheduled for July 23, 2026.


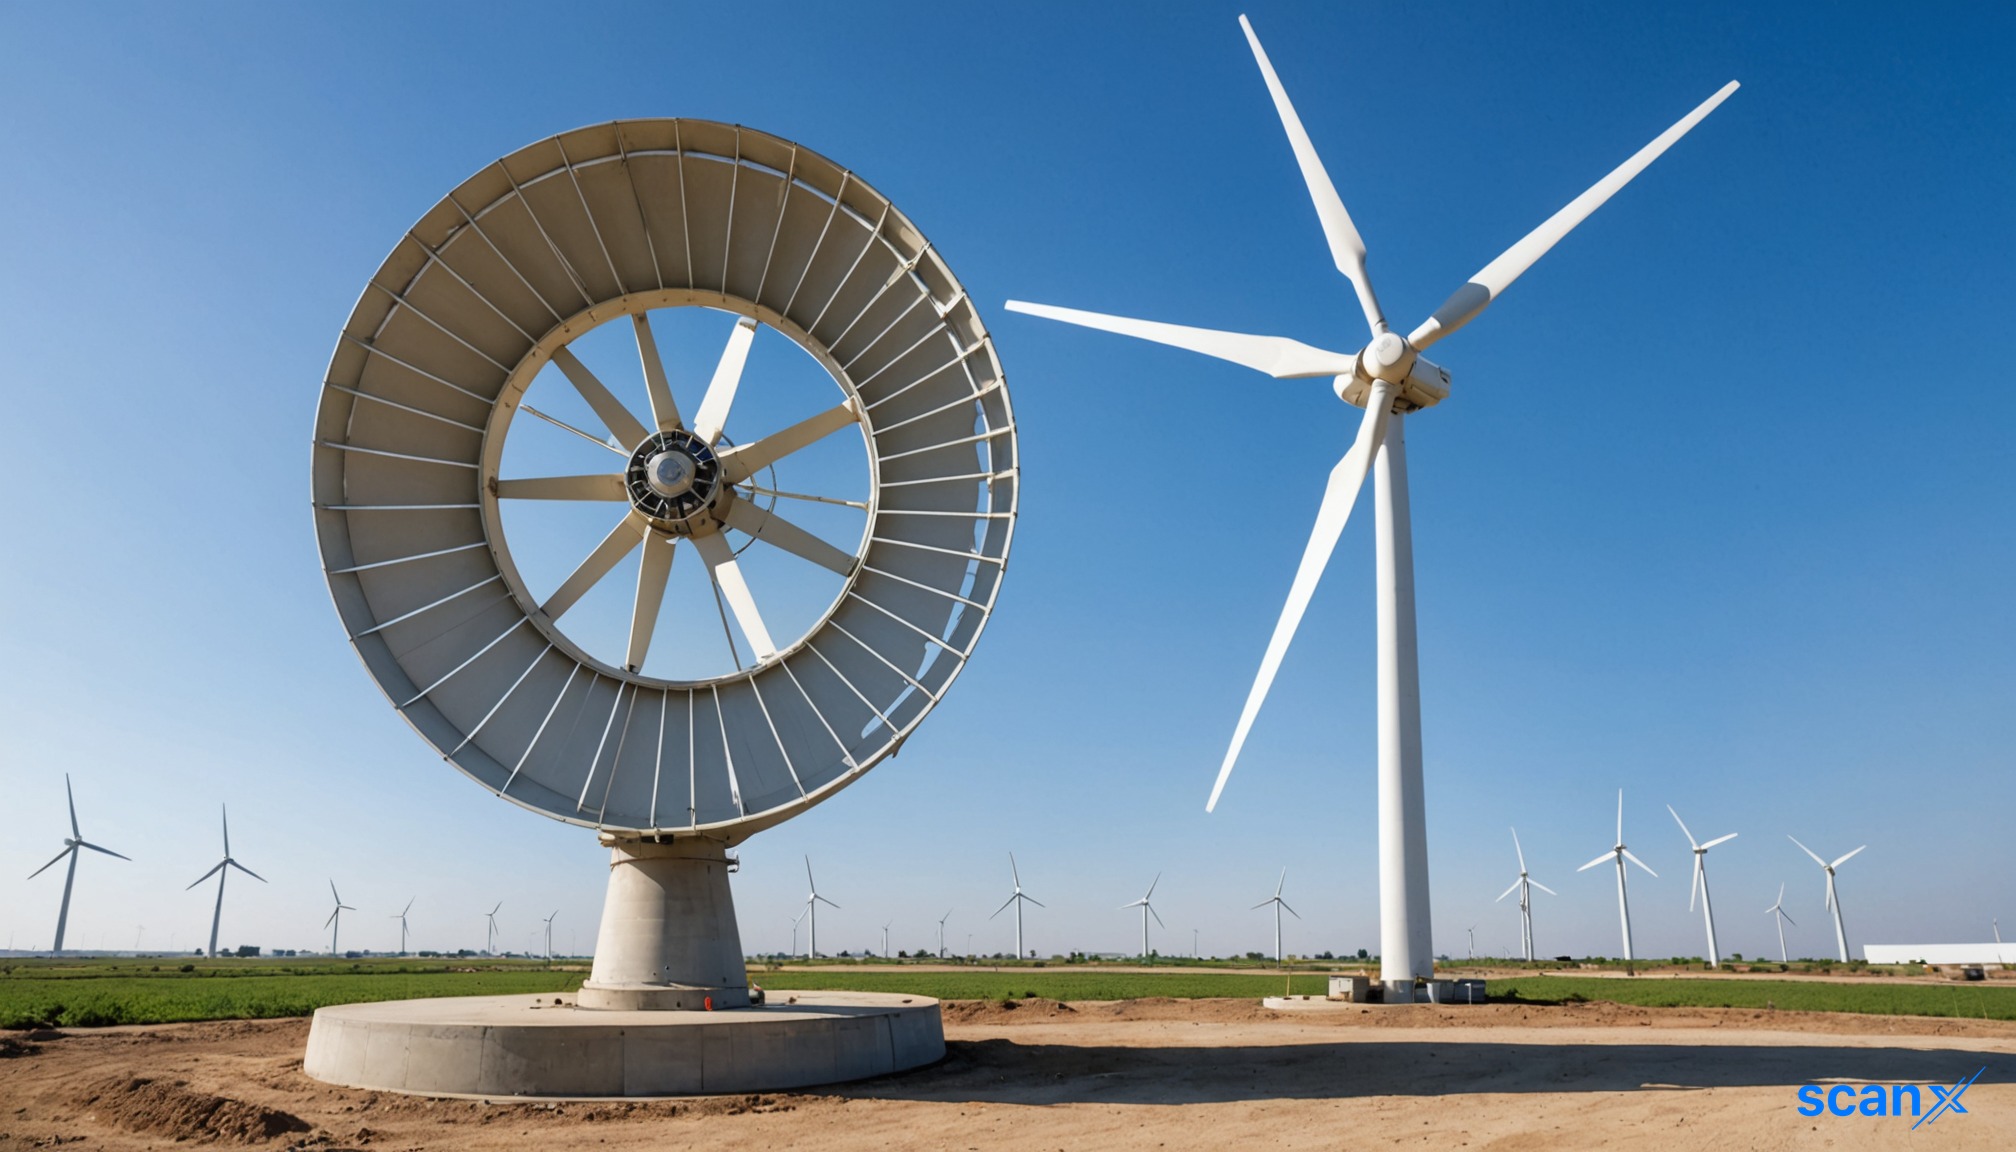
*this image is generated using AI for illustrative purposes only.
Synergy Green Industries Limited has filed a revised Annual Report for the financial year 2025-26 with BSE Limited and the National Stock Exchange of India Ltd., following the identification of certain typographical errors in the original report submitted on July 01, 2026. The company clarified that these typographical errors do not impact the financial statements for the year ended March 31, 2026, and that the corrigendum should be read in conjunction with the original Annual Report. The revised report has been made available on the websites of BSE, NSE, and the company's website at https://synergygreenind.com/investors-relations/ .
Financial Performance for FY 2025-26
The company recorded total income of ₹37,637.36 Lakhs in FY 2025-26, compared to ₹36,368.30 Lakhs in the previous year, representing a marginal growth of 3.49%. Export revenues rose to ₹10,564.63 Lakhs from ₹9,777.44 Lakhs in the prior year, an increase of 8.05%, and accounted for approximately 27% of total revenues. The following table summarises the key standalone financial results:
| Metric: | FY 2025-26 (₹ Lakhs) | FY 2024-25 (₹ Lakhs) |
|---|---|---|
| Total Income: | 37,637.36 | 36,368.30 |
| Profit Before Depreciation, Interest & Tax: | 4,932.18 | 5,369.91 |
| Depreciation & Amortization: | 2,032.87 | 1,302.09 |
| Finance Cost: | 2,078.61 | 1,569.23 |
| Profit Before Tax: | 820.70 | 2,498.59 |
| Profit After Tax: | 465.83 | 1,688.82 |
| Earnings Per Share (Basic & Diluted) (₹): | 3.00 | 11.14 |
Profitability was impacted by higher outsourcing and operating costs associated with the relocation and stabilization of the new unit, increased finance costs and depreciation linked to capital expenditure, and lower export realizations during the development phase of the in-house machining facility. PBDIT stood at ₹4,932.18 Lakhs against ₹5,369.91 Lakhs in the previous year, a year-on-year decline of 8.15%. Profit after tax for the year was ₹465.83 Lakhs, compared to ₹1,688.82 Lakhs in the prior year.
Multi-Year Financial Highlights
The following table presents the company's revenue and key profitability metrics over the past six financial years:
| Financial Year: | Revenue (₹ Crs) | EBITDA (₹ Crs) | Profit After Tax (₹ Crs) | EPS (₹) |
|---|---|---|---|---|
| FY 25-26: | 376 | 49.3 | 4.66 | 3.00 |
| FY 24-25: | 364 | 53.7 | 16.89 | 11.14 |
| FY 23-24: | 328 | 41.1 | 11.56 | 7.70 |
| FY 22-23: | 290 | 26.8 | 0.87 | 0.61 |
| FY 21-22: | 285 | 25.3 | 1.43 | 1.01 |
| FY 20-21: | 200 | 25.2 | 3.18 | 2.25 |
Transformational Capex Programme and Operational Milestones
FY 2025-26 was described as a transformational year, marked by the successful completion of the company's ₹217 crore capex programme spanning foundry expansion, in-house machining, and captive solar power. The investments were funded through the Rights Issue completed in October 2024, internal accruals, and debt financing. Key operational milestones achieved during the year included:
- Completion of brownfield foundry expansion, enhancing single product weight capability from 23 MT to 30 MT and increasing overall foundry capacity from 30,000 TPA to 45,000 TPA.
- Establishment of a new fettling and inspection facility designed for 45,000 TPA capacity.
- Development of 12 new products across major OEM customers on higher MW turbine platforms of up to 5 MW.
- Commissioning of state-of-the-art machining and surface treatment facilities with an installed capacity of 20,000 TPA.
- Expansion of captive solar power capacity from 2 MW to 10 MW.
Key Financial Ratios
The company reported significant changes in several key financial ratios for FY 2025-26 compared to FY 2024-25, primarily reflecting the impact of the capital expenditure programme:
| Key Financial Ratio: | FY 2025-26 | FY 2024-25 |
|---|---|---|
| Debtors Turnover: | 5.76 | 7.88 |
| Debt-Equity Ratio: | 2.25 | 1.45 |
| Interest Coverage Ratio: | 2.37 | 3.42 |
| Net Profit Ratio (%): | 1.28% | 4.69% |
| Return on Net Worth (%): | 4.26% | 21.88% |
The increase in the Debt-Equity Ratio to 2.25 from 1.45 reflects borrowings availed for the capex programme. The decline in the Net Profit Ratio and Return on Net Worth is attributed to higher depreciation and finance costs associated with the capital expenditure and a lower profit after tax for the year.
Human Resources and Workforce
The company had 252 permanent employees on its rolls as on March 31, 2026. The median remuneration of employees during the financial year was Rs. 4.81 Lakh, with an increase of 6.43% in the median remuneration compared to the previous year. The company maintained a Zero TRIR (Total Recordable Incident Rate) for four consecutive years and holds ISO 45001 Occupational Health & Safety Management System certification.
16th Annual General Meeting and AGM Agenda
The 16th Annual General Meeting of the company is scheduled for Thursday, July 23, 2026, at 11:00 A.M., to be held at the Registered Office through Video Conferencing. The remote e-voting period opens on Monday, July 20, 2026, at 09:00 A.M. and closes on Wednesday, July 22, 2026, at 05:00 P.M. Key items of business at the AGM include:
- Adoption of standalone and consolidated audited financial statements for the year ended March 31, 2026.
- Re-appointment of Mr. Niraj S. Shirgaokar as a director retiring by rotation.
- Declaration of dividend on 10% Redeemable Cumulative Preference Shares for FY 2025-26.
- Appointment of M/s P. G. Bhagwat LLP, Chartered Accountants, as statutory auditors for a period of 5 years in place of retiring auditors M/s D A B & Associates.
- Continuation of Mr. Subhash G. Kutte as Independent Director under Regulation 17(1A) of SEBI (LODR) Regulations 2015.
- Increase in borrowing limits under Section 180(1)(c) and 180(1)(a) of the Companies Act, 2013 from Rs. 200.00 Crores to Rs. 250.00 Crores.
- Ratification of remuneration payable to Cost Auditor M/s. Dhananjay V. Joshi & Associates for FY 2026-27 at Rs. 2,50,000/-.
- Acceptance/renewal of unsecured deposits from members under Section 73 of the Companies Act, 2013.
Source: https://lodr-files.dhan.co/lodr-inputs/Company/INE00QT01015/364ad9b2-16d2-4115-a39c-972b5b94cc08.pdf
Historical Stock Returns for Synergy Green Industries
| 1 Day | 5 Days | 1 Month | 6 Months | 1 Year | 5 Years |
|---|---|---|---|---|---|
| +1.62% | +0.38% | +4.71% | +22.07% | +13.70% | +346.62% |

With the ₹217 crore capex programme now complete, what is the expected timeline for the new machining and solar facilities to reach optimal utilization and improve profit margins?
Given the rise in the Debt-Equity ratio to 2.25, what are the company's strategies for debt reduction and improving the Interest Coverage Ratio in the coming fiscal year?
How will the development of 12 new products for up to 5 MW turbine platforms influence the revenue mix and export growth in FY 2026-27?
 19
19








 Access 50+ Readymade Screeners
  Use 200+ Custom Filters
  Get Full Market Insights





