

Steel Authority of India Q1FY27 Results: Net profit jumps 139% YoY


- Net profit surged 139% YoY to ₹1,636 crore in Q1FY27
- Sales turnover rose 1.1% to ₹26,010 crore with EBITDA up 48.9%
- EBITDA margin expanded to 16.7% driven by higher sales prices
- Debt stands at ₹31,970 crore with debt service coverage ratio of 1.66


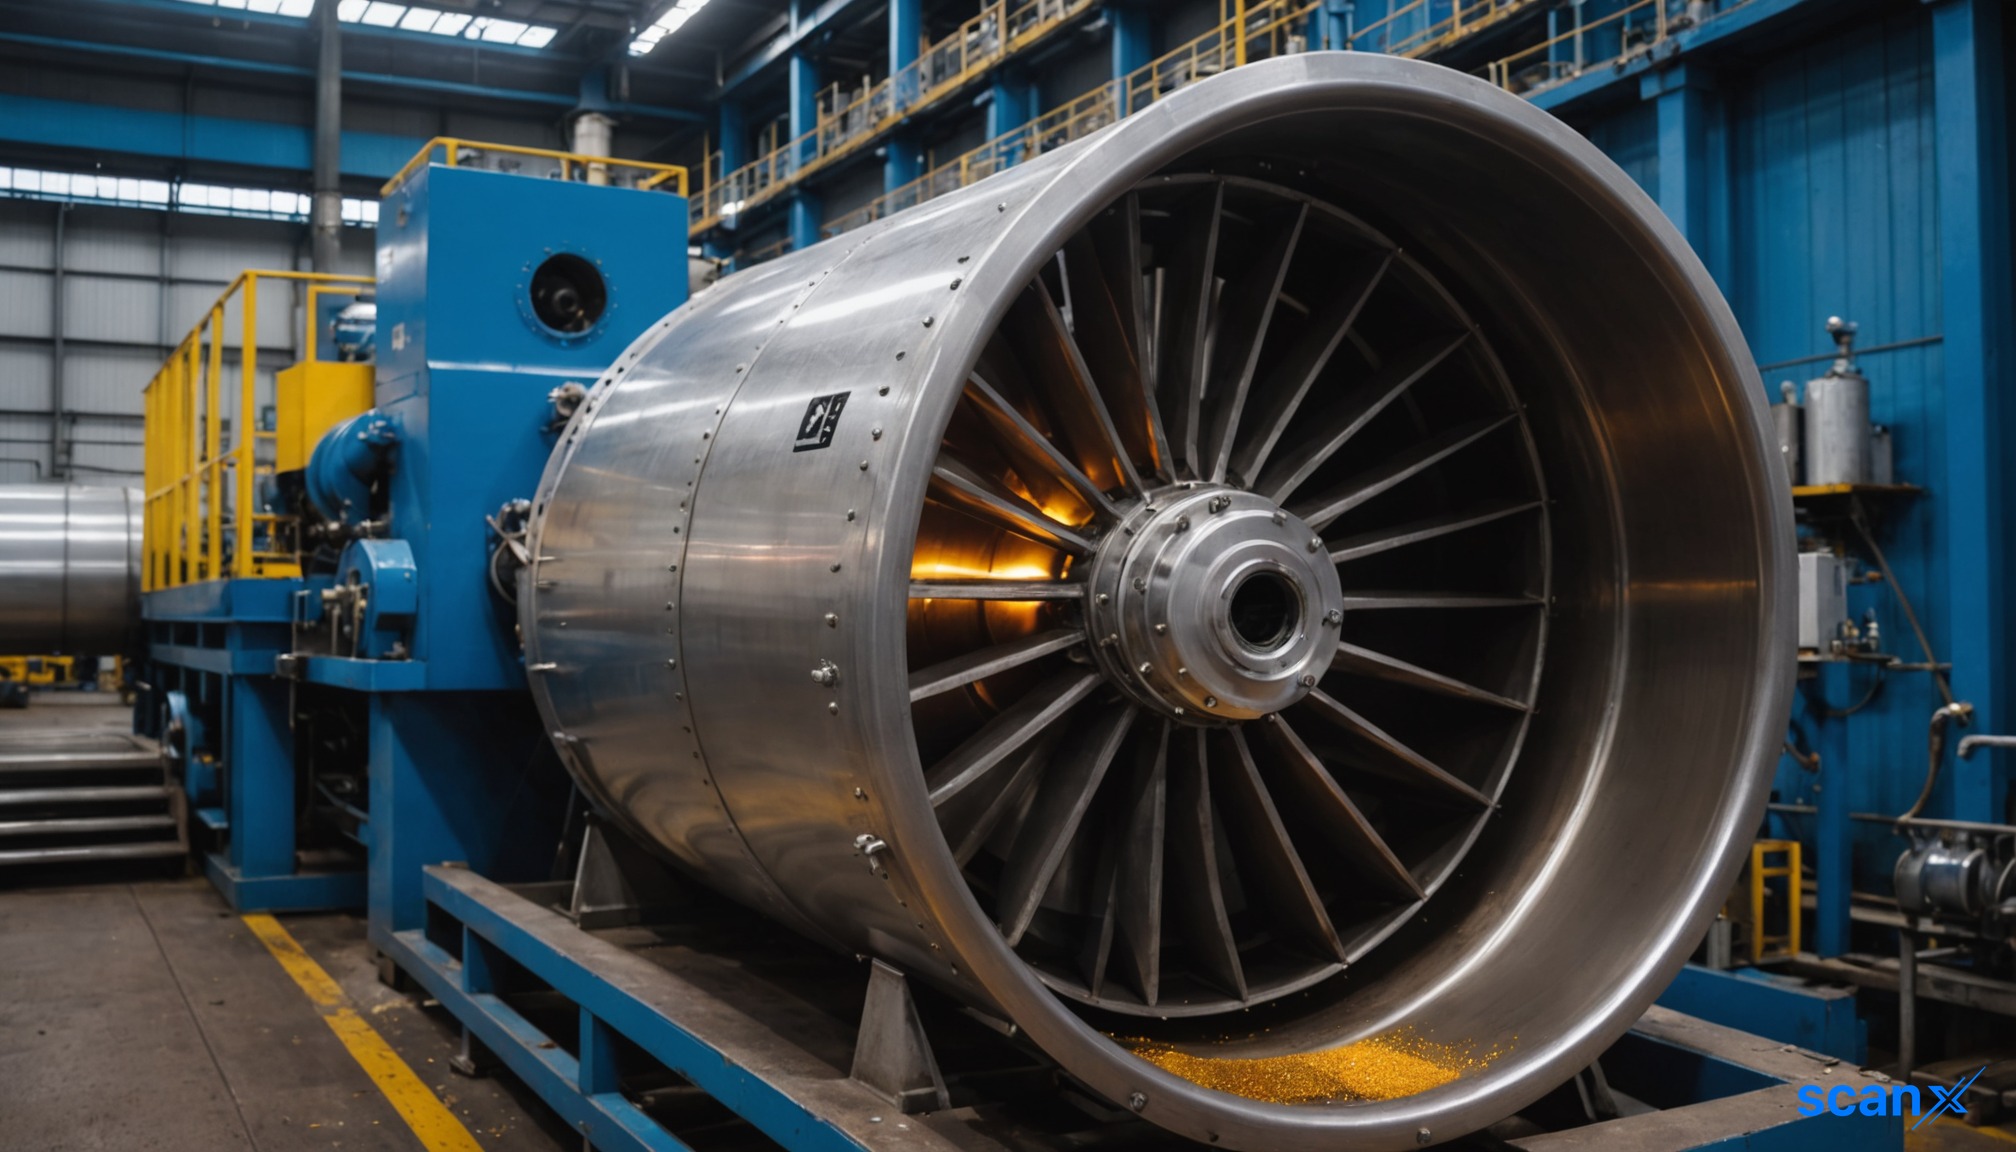
*this image is generated using AI for illustrative purposes only.
Steel Authority of India reported a sharp rise in profitability for the first quarter of FY27, driven by improved sales realizations and controlled input costs. The state-owned steel major logged a net profit after tax (PAT) of ₹1,636 crore, marking a significant recovery from the ₹685 crore recorded in the corresponding period of the previous year.
The company’s operational efficiency translated into robust top-line growth, with total income reaching ₹26,449 crore against ₹26,082 crore in Q1FY26. Sales turnover stood at ₹26,010 crore. This financial performance coincided with a domestic crude steel production growth of 3% and consumption growth of approximately 8% in the same period.
Financial Performance Snapshot
| Metric | Q1FY27 | Q1FY26 | Change |
|---|---|---|---|
| Sales Turnover | ₹26,010 crore | ₹25,731 crore | +1.1% |
| Total Income | ₹26,449 crore | ₹26,082 crore | +1.4% |
| EBITDA | ₹4,356 crore | ₹2,925 crore | +48.9% |
| Profit Before Tax | ₹2,159 crore | ₹890 crore | +142.6% |
| Net Profit After Tax | ₹1,636 crore | ₹685 crore | +138.8% |
What the Numbers Show
The improvement in earnings was primarily fueled by favorable price movements rather than volume expansion. While sales volumes contributed negatively to EBITDA by ₹201 crore compared to Q1FY26, sales price increases added ₹3,147 crore to the bottom line. Conversely, higher input costs reduced EBITDA by ₹1,525 crore. The net result was an EBITDA margin expansion to 16.7% from 11.5% in the prior year’s first quarter.
Exceptional items impacted pre-tax profits by ₹144 crore, reducing the profit before tax from ₹2,303 crore to ₹2,159 crore. Despite this, the company maintained a strong interest coverage ratio of 4.80, indicating sufficient operating cash flow to meet debt obligations. The debt service coverage ratio stood at 1.66. Total debt remained stable at ₹31,970 crore, while the debt-equity ratio under IndAS standards stood at 0.54, reflecting a stable capital structure amidst rising net worth of ₹59,720 crore as of June 2026.
Operational Highlights
SAIL produced 4.757 million tonnes of crude steel in Q1FY27, down slightly from 4.9 million tonnes in Q1FY26 but up from 4.8 million tonnes in Q4FY26. Saleable steel production was 4.516 million tonnes. Domestic sales accounted for 4.106 million tonnes, while exports remained minimal at 0.057 million tonnes. The product mix across its five integrated steel plants showed flats commanding a 52.7% share, followed by longs at 34.8% and semis at 12.5%.
Historical Stock Returns for Steel Authority of India
| 1 Day | 5 Days | 1 Month | 6 Months | 1 Year | 5 Years |
|---|---|---|---|---|---|
| -0.32% | -2.01% | -8.26% | +4.68% | +25.31% | 0.0% |

Can SAIL sustain its expanded EBITDA margins of 16.7% in Q2FY27 given the potential for fluctuating global steel prices and rising input costs?
How will the company's stable debt levels and strong interest coverage ratio influence its capacity for future capital expenditure or acquisitions?
What specific strategies is SAIL implementing to reverse the negative volume contribution to EBITDA observed in Q1FY27?
 18
18











 Access Market Heat-map & Insights
  Create, Save & Share your Screener
  Use 200+ Screening Filters





