

Metro Brands H1FY27 results: Revenue up 13.4% YoY to ₹1,451 crore


- Consolidated revenue rose 13.4% YoY to ₹1,451 crore in H1FY27
- EBITDA increased 12.9% YoY to ₹413 crore with a 28.5% margin
- Net profit grew 2.8% YoY to ₹173 crore
- Store network expanded to 1,053 outlets across 223 cities
- E-commerce sales contributed 13.6% of total revenue

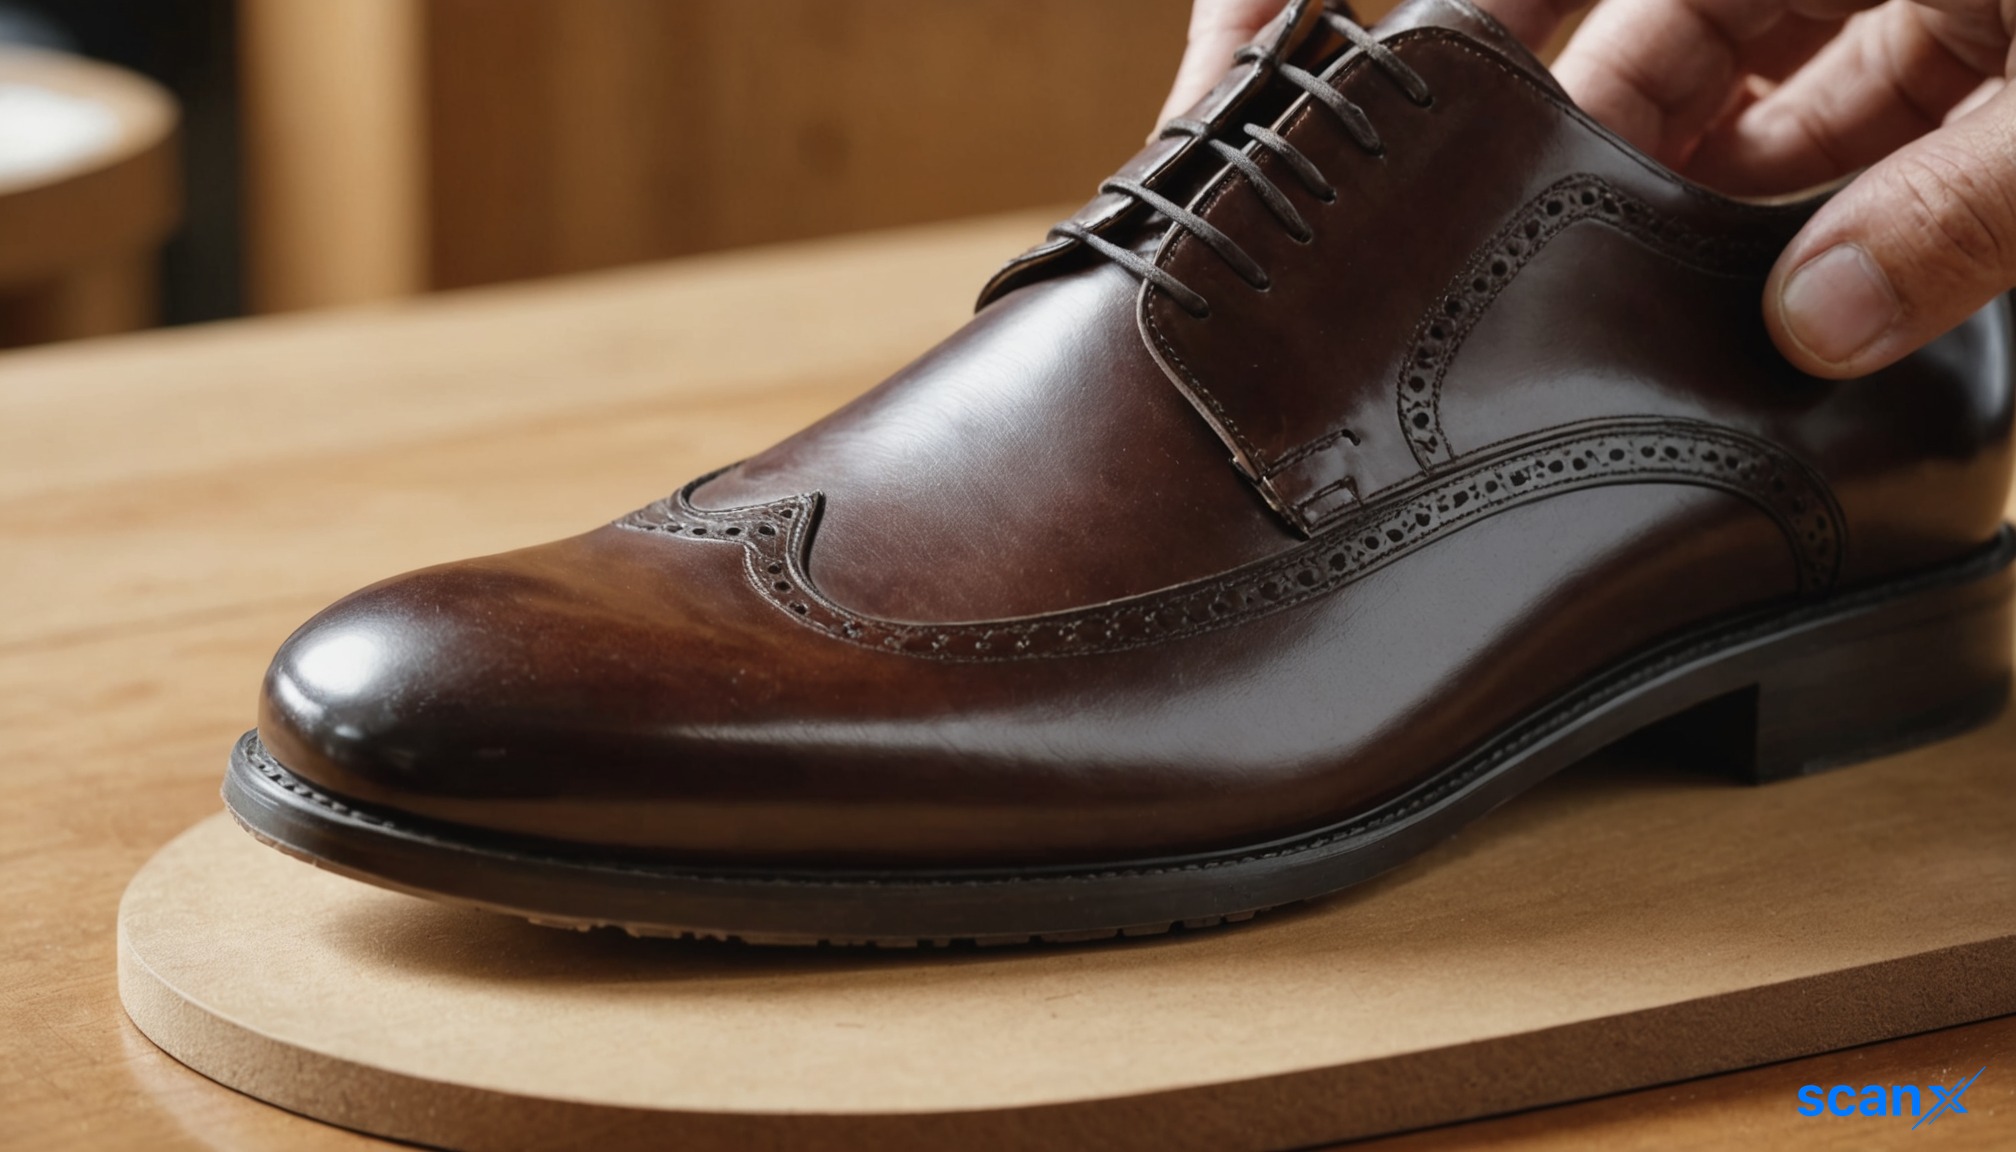

*this image is generated using AI for illustrative purposes only.
Metro Brands reported a 13.4% year-on-year increase in consolidated revenue from operations for the half year ended September 30, 2026 (H1FY27). The company clocked revenue of ₹1,451 crore, while EBITDA rose 12.9% YoY to ₹413 crore, reflecting an EBITDA margin of 28.5%. Consolidated net profit increased 2.8% to ₹173 crore.
The Board of Directors approved these unaudited financial results at its meeting held on October 15, 2026. Management noted that the period saw stable growth as the festive calendar shifted a larger share of consumer demand into Q3. Despite this shift, the company delivered double-digit revenue growth, with EBITDA expanding ahead of revenue due to operational execution and gross margin expansion.
Financial Performance Overview
The company’s performance was supported by robust top-line growth, although margins faced pressure from higher employee costs and depreciation. Total income for the half year reached ₹1,500 crore, while total expenses increased to ₹1,270 crore. The following table highlights key standalone metrics:
| Metric | H1FY27 | H1FY26 | Change |
|---|---|---|---|
| Revenue from Operations | ₹1,413 crore | ₹1,251 crore | +13.0% |
| Total Income | ₹1,461 crore | ₹1,305 crore | +12.0% |
| Total Expenses | ₹1,242 crore | ₹1,091 crore | +13.8% |
| Profit Before Tax | ₹219 crore | ₹214 crore | +2.3% |
| Net Profit (PAT) | ₹164 crore | ₹161 crore | +1.9% |
| EPS (Basic) | ₹6.02 | ₹5.91 | +1.9% |
Consolidated Results
On a consolidated basis, Metro Brands recorded revenue from operations of ₹1,451.27 crore, a 13.4% increase from ₹1,279.14 crore in H1FY26. The consolidated Profit Before Tax (PBT) grew 3.6% YoY to ₹230.26 crore. The group’s share of profit from joint ventures contributed ₹1.00 crore to the bottom line.
Key consolidated figures include:
- Revenue: ₹1,451.27 crore (up 13.4% YoY)
- EBITDA: ₹413 crore (up 12.9% YoY, margin 28.5%)
- Net Profit: ₹173 crore (up 2.8% YoY, margin 11.9%)
- Total Comprehensive Income: ₹173 crore
Operational Highlights
E-commerce sales, including omni-channel, grew 11% year-on-year and contributed 13.6% of revenue. The company strengthened its retail footprint with 34 new store openings in H1FY27, offset by 13 store closures. As of September 30, 2026, Metro Brands operated 1,053 stores across 223 cities and 31 states and Union Territories.
Nissan Joseph, CEO, stated that the company remains focused on strengthening its brand portfolio and expanding retail presence. He noted that despite festive sales shifting to the following quarter, the company is well positioned to build on this momentum.
Strategic Updates on New Formats
The company provided updates on its newer brand partnerships and formats:
- Clarks: Ladies' range is available in over 400 multi-brand outlets (MBOs). Complete product supply is expected by Q3, with exclusive brand outlets (EBOs) planned for the latter half of FY27.
- Foot Locker & MetroActiv: Expansion pace has been constrained by BIS implementation challenges among select external brands, though early signs of normalization are emerging.
- Fila: Local manufacturing has commenced due to BIS concerns. Repositioning with sharper merchandise and pricing is underway, with store expansion expected to pick up from FY29.
- New Era: Strategy is shifting from kiosks to an EBO-led model. Two EBOs were opened and four kiosks closed during the quarter.
What the Numbers Show
A closer look at the expense structure reveals that while revenue grew nearly 13%, employee benefits expenses surged by 24.4% YoY to ₹153 crore, outpacing the top-line growth. Similarly, depreciation and amortization expenses rose 17.7% YoY to ₹173 crore. This indicates that operational leverage is being partially offset by rising fixed costs and workforce expansion. However, the consolidated EBITDA growth of 12.9% exceeding revenue growth of 13.4% suggests that gross margin expansion helped absorb some of these cost pressures, keeping net profit growth steady at 2.8%.
Balance Sheet and Cash Flow
The company’s balance sheet reflects continued investment in inventory and store infrastructure. Inventories increased to ₹957 crore as on September 30, 2026, from ₹856 crore as on March 31, 2026. Trade receivables also saw an uptick to ₹119 crore from ₹95 crore in the same period.
Cash flow from operating activities remained healthy, with net cash generated from operations standing at ₹248 crore for the six months ended September 30, 2026, significantly higher than ₹141 crore in the previous year’s corresponding period. The company paid a final dividend of ₹3.00 per equity share during the quarter.
Historical Stock Returns for Metro Brands
| 1 Day | 5 Days | 1 Month | 6 Months | 1 Year | 5 Years |
|---|---|---|---|---|---|
| -0.20% | +8.90% | -4.43% | -11.97% | -24.35% | +82.13% |

How will the shift of festive demand into Q3 FY27 impact Metro Brands' full-year revenue guidance and inventory turnover ratios?
What specific cost-control measures is management implementing to curb the 24.4% surge in employee benefits and protect future net profit margins?
What is the projected timeline for resolving BIS compliance issues to accelerate the expansion of Foot Locker, MetroActiv, and Fila stores?
 18
18







 Access 50+ Readymade Screeners
  Use 200+ Custom Filters
  Get Full Market Insights





