

Apple trades at valuation premium to tech hardware peers


- Apple's P/E ratio of 37.78 is below the industry average of 43.98, suggesting potential value relative to peers.
- The company's Price-to-Book ratio of 44.71 exceeds the industry mean of 20.21 by more than two times.
- Revenue growth of 16.36% lags significantly behind the sector average of 66.52%, highlighting a mature growth phase.
- EBITDA of $39.02 billion is 21.92 times the peer average, underscoring superior operational scale and efficiency.


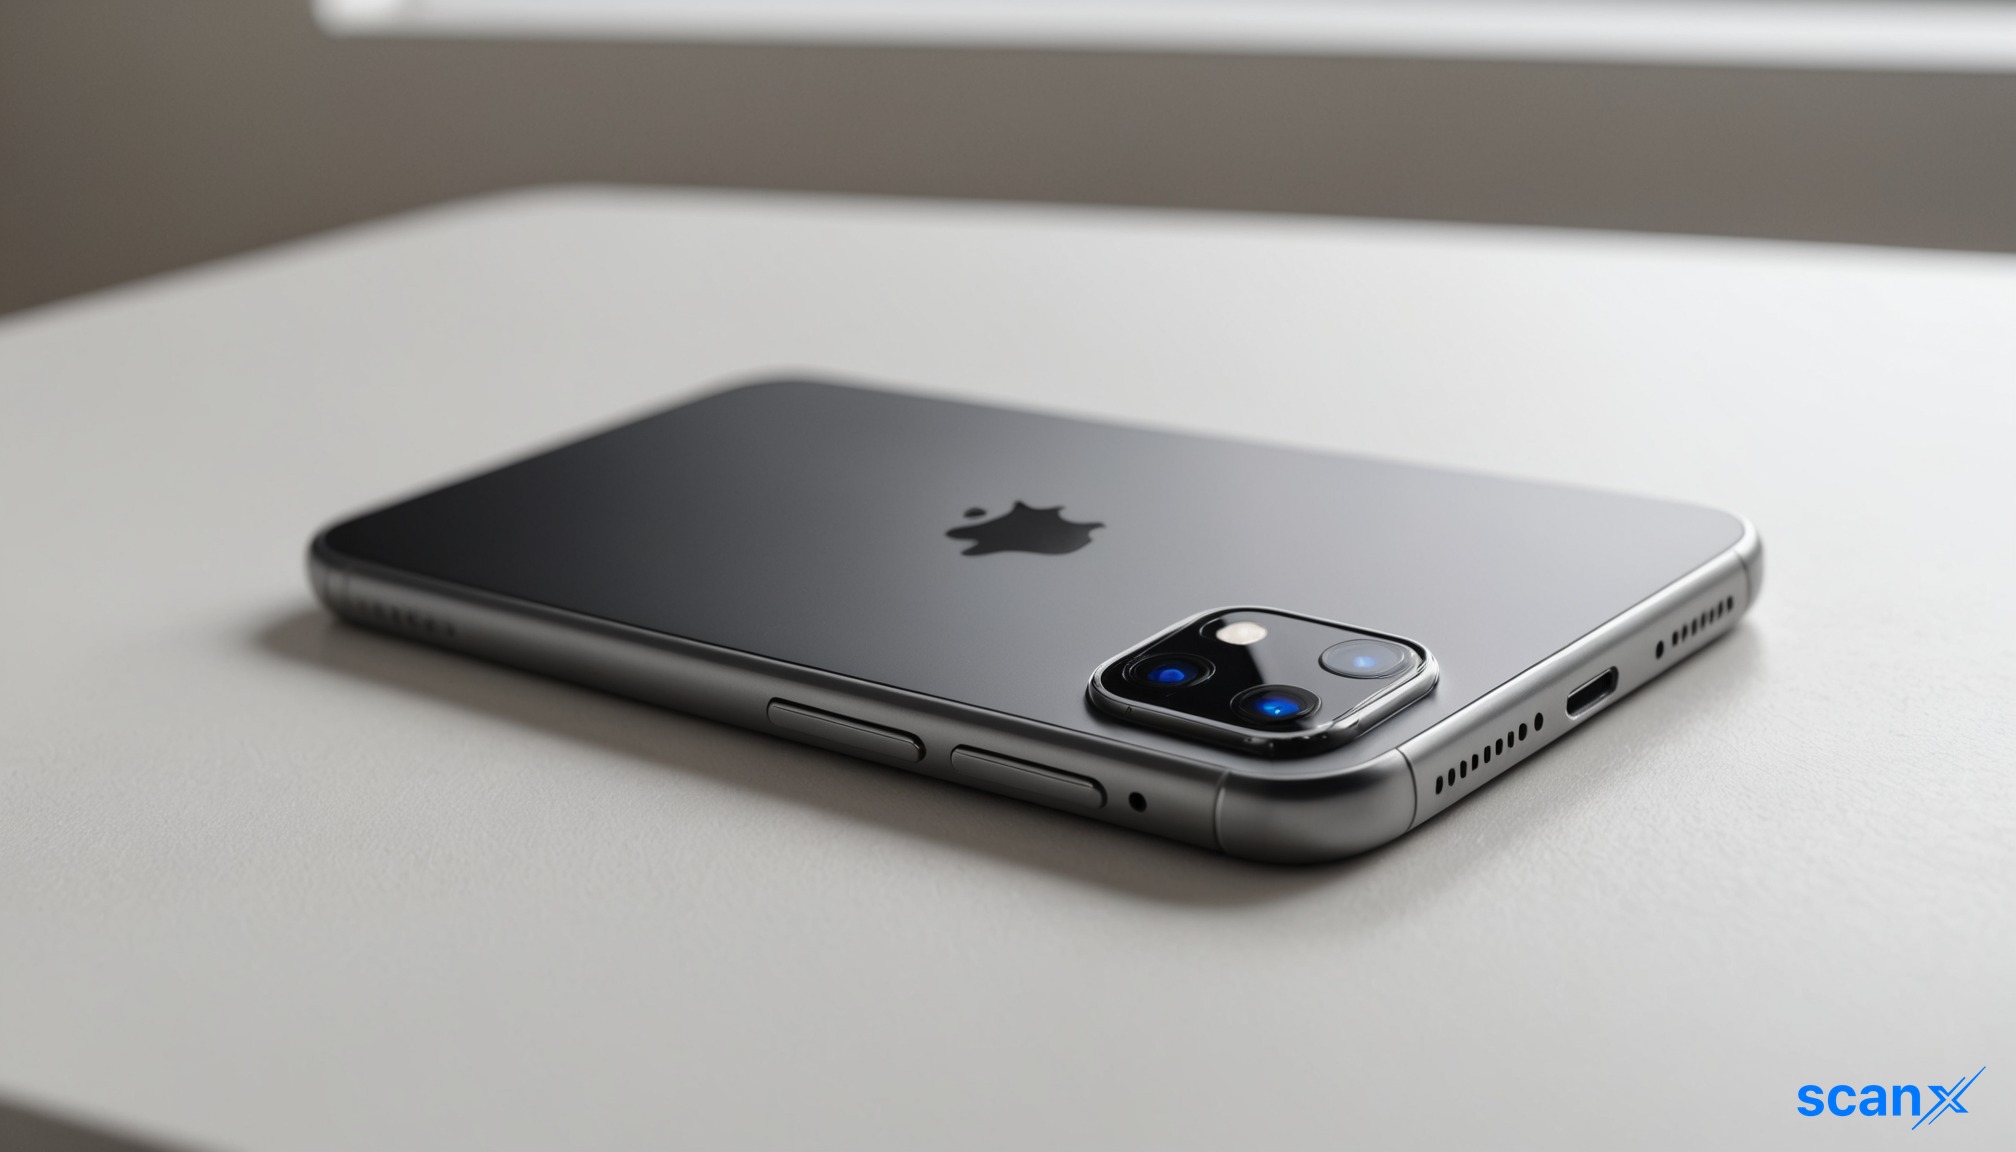
*this image is generated using AI for illustrative purposes only.
Apple Inc (NASDAQ: AAPL) commands significant valuation multiples relative to its Technology Hardware, Storage & Peripherals peers, trading at a Price-to-Earnings ratio of 37.78 compared to the updated industry average of 43.98.
The Cupertino-based firm’s premium pricing is underpinned by superior profitability metrics and scale, though its revenue growth lags the sector average.
Valuation Premiums
Apple’s valuation metrics exceed industry benchmarks across key multiples, although its P/E ratio is slightly lower than the peer average:
| Metric | Apple | Industry Average | Variance |
|---|---|---|---|
| P/E Ratio | 37.78 | 43.98 | -6.20x |
| P/B Ratio | 44.71 | 20.21 | +24.50x |
| P/S Ratio | 10.43 | 6.75 | +3.68x |
The stock’s Price-to-Book ratio of 44.71 is more than two times the sector mean, while its Price-to-Sales multiple of 10.43 suggests investors are paying a substantial premium for each dollar of sales.
Profitability vs Growth Divergence
Despite higher valuations on book value and sales, Apple demonstrates robust operational efficiency. Its Return on Equity stands at 27.84%, surpassing the industry average of 22.33% by 5.51 percentage points.
The company generates $39.02 billion in EBITDA, which is 21.92 times the peer average of $1.78 billion. Gross profit totals $54.77 billion, significantly outpacing the sector norm of $2.15 billion.
However, this profitability comes with slower top-line expansion. Apple’s revenue growth of 16.36% trails the industry average of 66.52%, indicating a mature market position compared to faster-growing peers like SanDisk Corp (371.59%) and Super Micro Computer Inc (93.16%).
Balance Sheet Strength
Apple maintains a conservative capital structure with a Debt-to-Equity ratio of 0.78. This figure is lower than its top four peers in this metric, suggesting a stronger financial position and lower leverage risk relative to competitors.
What the Numbers Show
A critical divergence exists between Apple’s valuation multiples and its growth trajectory. While the stock trades at nearly double the industry average on a Price-to-Sales basis, its revenue growth (16.36%) is less than one-quarter of the sector average (66.52%). This suggests the market is pricing Apple not on current sales acceleration, but on its exceptional profit margins ($54.77 billion gross profit) and high Return on Equity (27.84%), treating it as a quality compounder rather than a high-growth hardware play.

How might Apple's upcoming product cycles impact its revenue growth trajectory to better align with the 66.52% sector average?
What specific services or AI initiatives could drive the next phase of margin expansion to justify the 44.71x Price-to-Book ratio?
Could rising interest rates or macroeconomic headwinds pressure the 37.78 P/E multiple given the current growth divergence?
 16












 Access 50+ Readymade Screeners
 Use 200+ Custom Filters
 Get Full Market Insights





