

APL Apollo Tubes Q2FY27 Results: Sales volume rises 13% YoY to record 963,143 tons


- Record Q2FY27 sales volume of 963,143 tons, up 13% YoY and 29% QoQ
- H1FY27 volume grew 4% YoY to 1,707,966 tons, lagging annual targets
- Core APL Apollo Brand contributed 774,751 tons to Q2FY27 total
- Roofing Products volume rose to 135,255 tons from 91,516 tons in Q1FY27

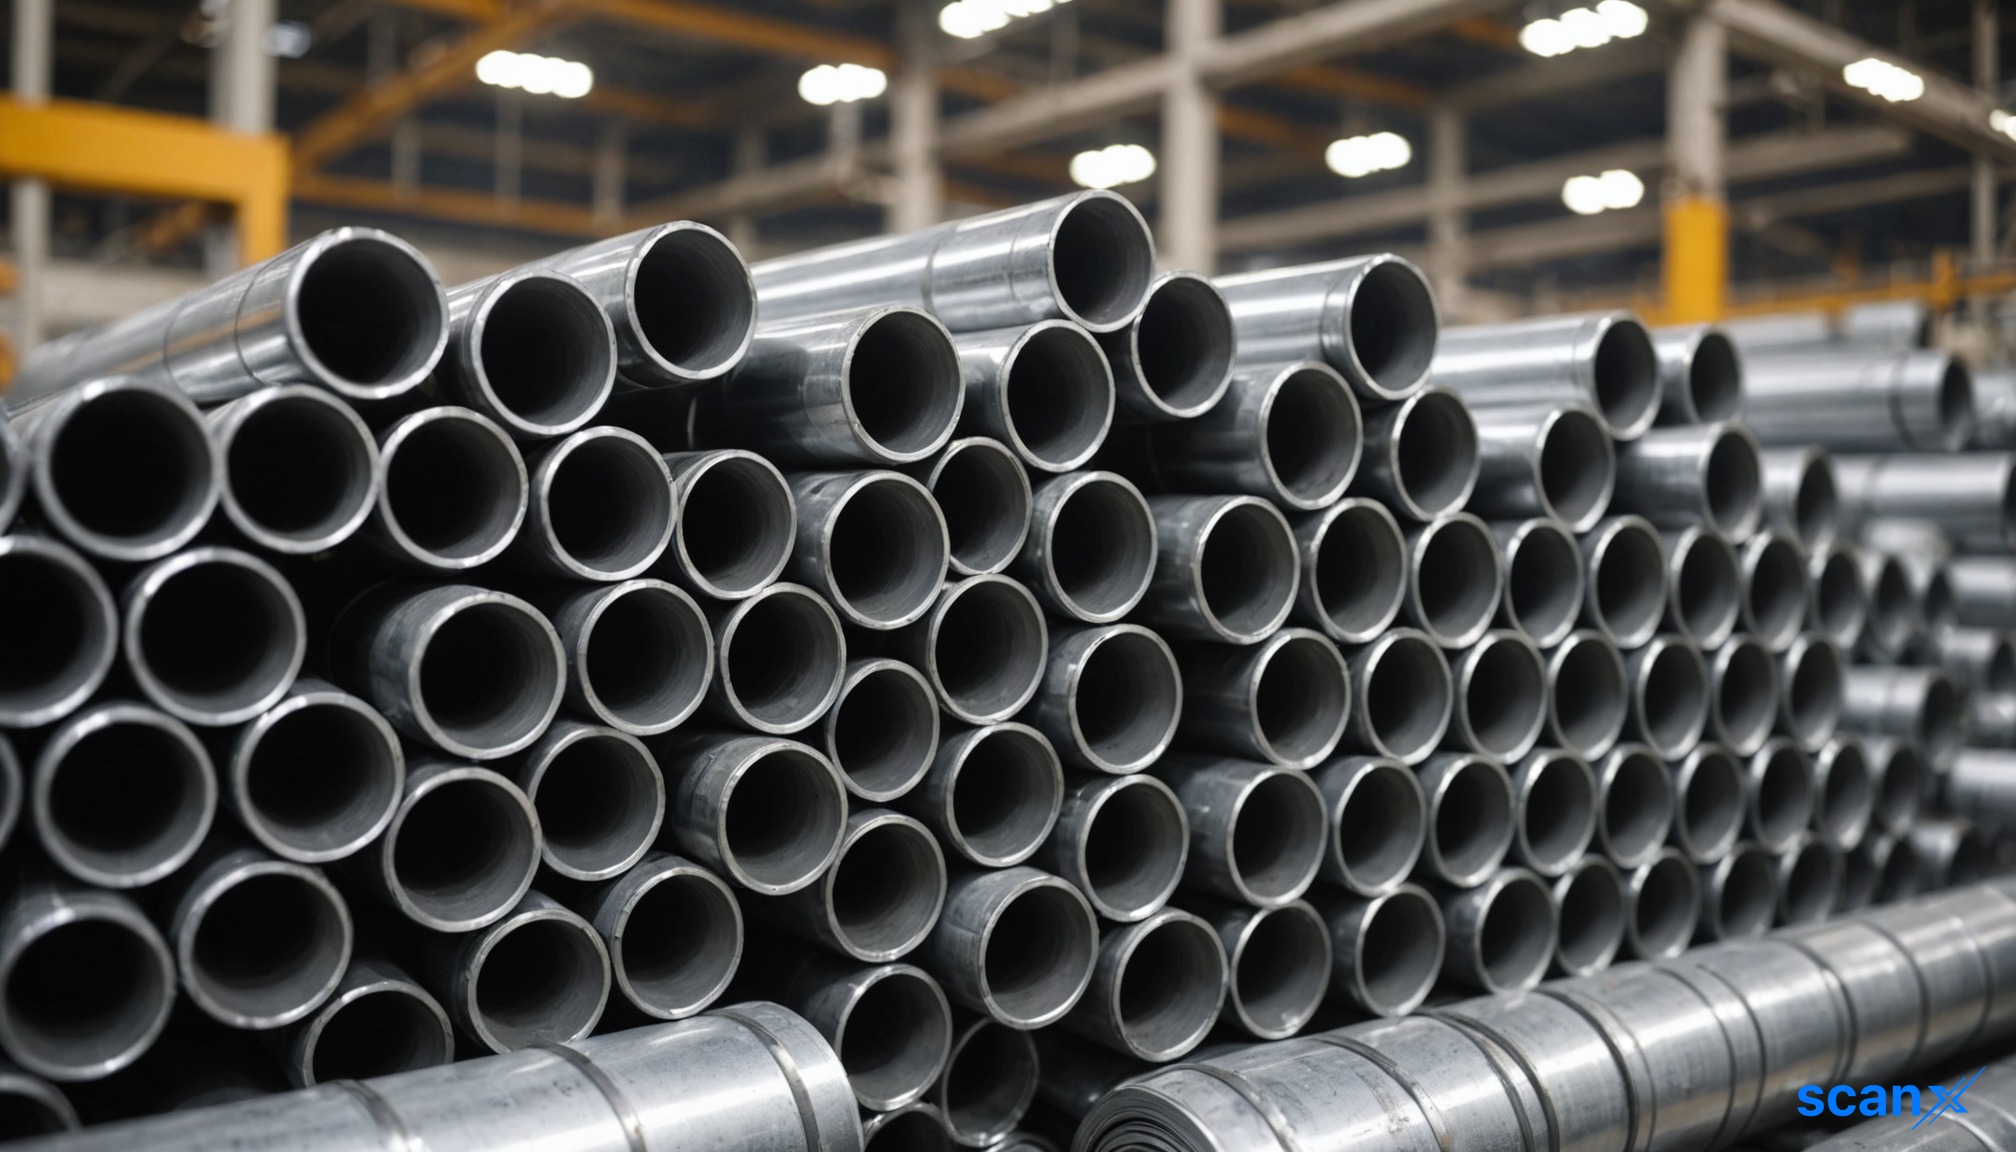

*this image is generated using AI for illustrative purposes only.
APL Apollo Tubes achieved a record sales volume of 963,143 tons in the second quarter of fiscal year 2027 (Q2FY27). This represents a 13% increase year-over-year and a significant 29% jump quarter-over-quarter.
Volume Performance and Targets
The company’s first-half FY27 (H1FY27) sales volume stood at 1,707,966 tons, marking a 4% growth compared to the same period in the previous fiscal year. Despite the strong quarterly performance, the cumulative H1 growth rate remains below the company’s stated annual target range of 15-20% for FY27.
| Metric | Q2FY27 | YoY Change | QoQ Change |
|---|---|---|---|
| Sales Volume | 963,143 tons | +13% | +29% |
| Metric | H1FY27 | YoY Change |
|---|---|---|
| Sales Volume | 1,707,966 tons | +4% |
Product Category Breakdown
The company disclosed a detailed breakdown of sales volumes across its key product categories for Q2FY27. The core APL Apollo Brand segment contributed the largest share at 774,751 tons, showing robust growth from 568,691 tons in Q1FY27 and 653,680 tons in Q2FY26. Roofing Products also saw significant expansion, rising to 135,255 tons in Q2FY27 from 91,516 tons in the previous quarter.
SG Premium Brand volumes declined to 26,910 tons in Q2FY27 from 58,686 tons in Q1FY27, while UAE Operations remained relatively stable at 26,227 tons, down from 57,931 tons in Q2FY26.
| Product Category (Ton) | Q2FY27 | Q1FY27 | Q2FY26 | H1FY27 | H1FY26 | FY26 |
|---|---|---|---|---|---|---|
| APL Apollo Brand | 774,751 | 568,691 | 653,680 | 1,343,442 | 1,293,938 | 2,656,024 |
| SG Premium Brand | 26,910 | 58,686 | 38,356 | 85,596 | 52,498 | 230,862 |
| UAE Operations | 26,227 | 25,929 | 57,931 | 52,156 | 106,093 | 214,021 |
| Roofing Products | 135,255 | 91,516 | 105,071 | 226,771 | 196,859 | 390,337 |
| Total | 963,143 | 744,823 | 855,037 | 1,707,966 | 1,649,387 | 3,491,243 |
What the Numbers Show
A divergence is visible between the strong recent momentum and the broader annual trajectory. While Q2FY27 volume grew 13% YoY and 29% QoQ, the H1FY27 aggregate growth was only 4%. This suggests that the first quarter of FY27 likely saw flat or negative growth, pulling down the half-year average. To meet the 15-20% annual target, the company must sustain or accelerate this high-growth pace in the second half of the fiscal year.
The product mix data reveals that the record quarterly volume was driven primarily by the core APL Apollo Brand segment, which accounted for approximately 80% of total Q2FY27 sales. The sharp sequential jump in this segment (+36% QoQ) contrasts with the contraction in SG Premium Brand volumes (-54% QoQ), indicating a shift in demand concentration toward the primary brand portfolio during the quarter.
Historical Stock Returns for APL Apollo Tubes
| 1 Day | 5 Days | 1 Month | 6 Months | 1 Year | 5 Years |
|---|---|---|---|---|---|
| -2.79% | -3.01% | -6.03% | +9.91% | +26.27% | +159.07% |

Can APL Apollo sustain the 29% quarter-over-quarter growth momentum in Q3FY27 to bridge the gap toward its 15-20% annual volume target?
What factors are driving the sharp 54% sequential decline in SG Premium Brand volumes, and does this indicate a permanent shift in demand or a temporary inventory adjustment?
How will the continued contraction in UAE operations volumes impact the company's long-term international revenue diversification strategy?
 20
20








 Access Market Heat-map & Insights
  Create, Save & Share your Screener
  Use 200+ Screening Filters





