

APL Apollo reaffirms 20% EBITDA growth target for FY27 despite soft Q1 volumes


APL Apollo Tubes reported Q1FY27 net profit of ₹263.11 crore, up 11% YoY, despite a 6% volume decline. Management reaffirms full-year guidance of 15-20% volume and >20% EBITDA growth, citing strong pricing power and upcoming capacity expansions.


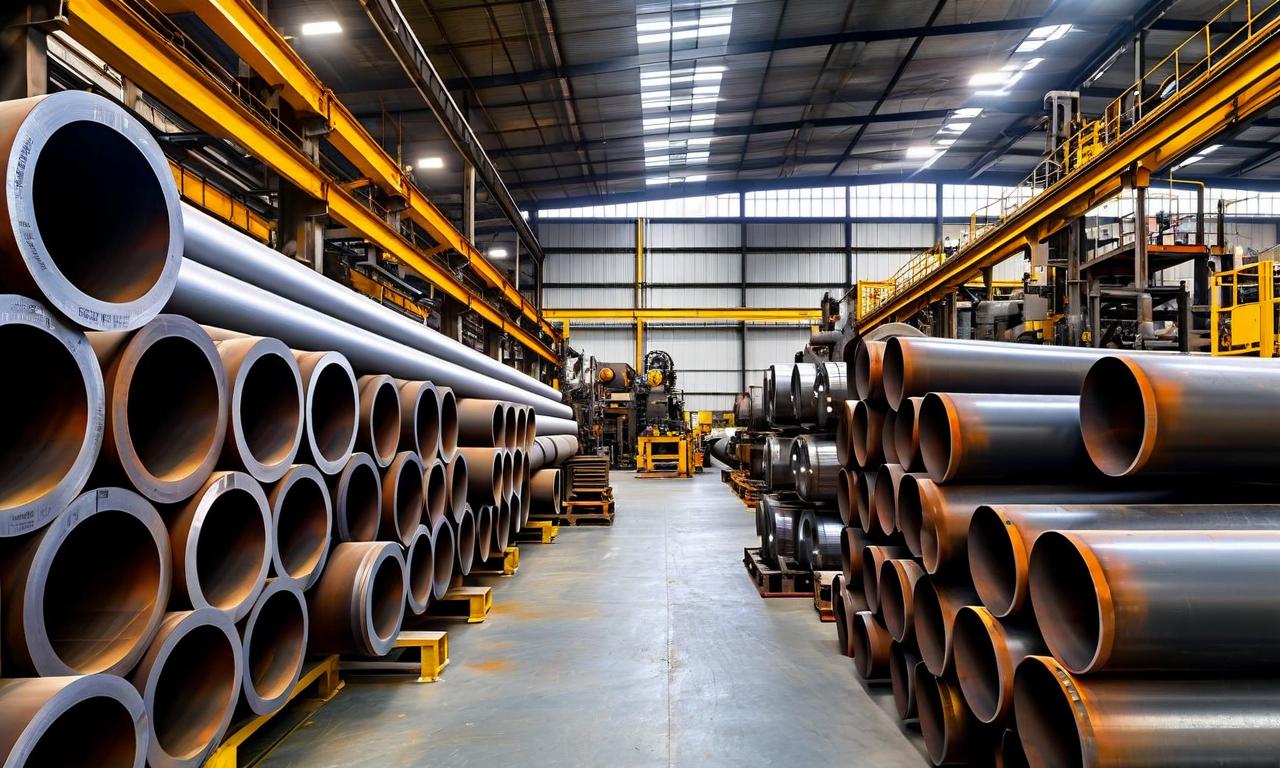
*this image is generated using AI for illustrative purposes only.
APL Apollo Tubes Limited reaffirmed its full-year guidance of 15% to 20% volume growth and more than 20% absolute EBITDA growth for FY27 during its Q1FY27 earnings conference call on August 3, 2026. Despite reporting a 6% year-on-year decline in sales volume to 744,823 tons in the quarter ended June 30, 2026, the company maintained robust profitability with consolidated net profit rising 11% to ₹263.11 crore. The management attributed the volume contraction to geopolitical disruptions in UAE operations, high factory inflation leading to channel destocking, and an energy crisis impacting specific product lines.
Chairman and Managing Director Sanjay Gupta stated that the company prioritized profitability over volume in Q1 due to uncertain macro conditions. Gross profit per ton increased by ₹1,000 quarter-on-quarter, allowing EBITDA per ton to remain flat above ₹5,500 despite a 20% sequential volume drop. Gupta confirmed that July volumes rebounded by 20% month-on-month to over 300,000 tons, signaling a recovery in demand as dealer destocking concluded. The company expects EBITDA spreads to range between ₹5,000 and ₹5,500 per ton for the remainder of FY27.
Operational Challenges and Recovery
The Q1 volume decline was driven by four primary factors. First, UAE operations lost approximately 25,000 tons quarter-on-quarter due to geopolitical tensions that halted incoming and outgoing logistics until July. Second, the SG Premium brand, which competes with secondary steel, suffered from a wide price gap between primary and secondary materials. Third, the energy crisis in India reduced demand for rust-proof pipes and roofing products by 25,000–30,000 tons. Finally, high factory inflation caused EPC contractors and real estate developers to delay purchases, impacting secondary sales across structural steel pipes and other construction materials.
Gupta noted that while the Dubai market had slowed to 5,000–6,000 tons per month, it recovered to 10,000–12,000 tons in July. The company currently holds 70,000 tons of inventory in transit and aims to restore Dubai volumes to 24,000–25,000 tons by September. Domestically, the company is ramping up marketing efforts and has tweaked pricing for select product categories to regain market share.
Capacity Expansion and Strategic Initiatives
APL Apollo is advancing a significant capacity expansion plan, with 2 million tons of new capacity expected to come online over the next two and a half years. This includes a 200,000-ton plant in Gorakhpur (starting September 2026), a 300,000-ton plant in Siliguri, and a 1-million-ton value-added plant in Malur. An additional 500,000-ton plant is being contemplated in Maharashtra or North Karnataka. These expansions aim to increase the share of value-added products from 65% to 75–80%, reducing dependency on commoditized segments and mitigating steel price volatility.
The Board also approved the acquisition of up to 20% equity in a Group Shared Services Company for up to ₹1 crore to consolidate HR, IT, and branding functions across the group. Additionally, the company rationalized manufacturing at subsidiary Apollo Metalex Limited by consolidating production from its Sikandrabad unit.
What the Numbers Show
The divergence between volume decline and profit growth highlights APL Apollo’s strong pricing power and operational leverage. While revenue grew 8.45% to ₹5,606.71 crore, EBITDA expanded 13.39% to ₹450.80 crore, driven by an 18% year-on-year increase in EBITDA per ton to ₹5,522. This margin expansion offset lower throughput, demonstrating the effectiveness of the pricing strategy adopted in January 2025, which repositioned branded products with a ₹500 per ton premium. The company’s net cash position remains strong at ₹14 billion, supporting its aggressive capex plans without diluting equity.
| Metric | Q1FY27 | Q1FY26 | Change |
|---|---|---|---|
| Sales Volume (tons) | 744,823 | 792,000* | -6% |
| Revenue (₹ crore) | 5,606.71 | 5,169.77 | +8.45% |
| EBITDA (₹ crore) | 450.80 | 397.57 | +13.39% |
| Net Profit (₹ crore) | 263.11 | 237.17 | +11% |
| EBITDA/Ton (₹) | 5,522 | 4,680* | +18% |
*Figures derived from reported changes and totals.
Management indicated that competitive intensity from upstream players like Tata and JSW entering the pipe segment is manageable, as APL Apollo maintains a 60–65% market share in structural tubes. The company is also exploring opportunities in solar infrastructure, targeting a 4–5% contribution to total volume from renewable energy projects over the next three years.
Historical Stock Returns for APL Apollo Tubes
| 1 Day | 5 Days | 1 Month | 6 Months | 1 Year | 5 Years |
|---|---|---|---|---|---|
| -2.01% | -5.11% | -7.20% | +7.15% | +19.76% | +144.22% |

How will the entry of upstream giants like Tata and JSW into the pipe segment impact APL Apollo's pricing power and market share over the next two years?
What specific risks could derail the aggressive 2 million-ton capacity expansion plan given the current energy crisis and geopolitical instability in key export markets?
Can APL Apollo realistically achieve its target of 4–5% volume contribution from solar infrastructure within three years, and how will this diversify its revenue streams?
 17
17










 Access Market Heat-map & Insights
  Create, Save & Share your Screener
  Use 200+ Screening Filters





