

APL Apollo Tubes files FY26 BRSR report with 58% renewable energy share


- Renewable electricity share jumped to 58% in FY26 from 31% in FY25
- Scope 2 emissions fell 33% to 83,186 tCO2e despite higher total energy use
- Water intensity improved to 27.6 KL/INR Cr from 32.3 KL/INR Cr
- Worker Lost Time Injury Frequency Rate dropped to 1.96 from 10.8


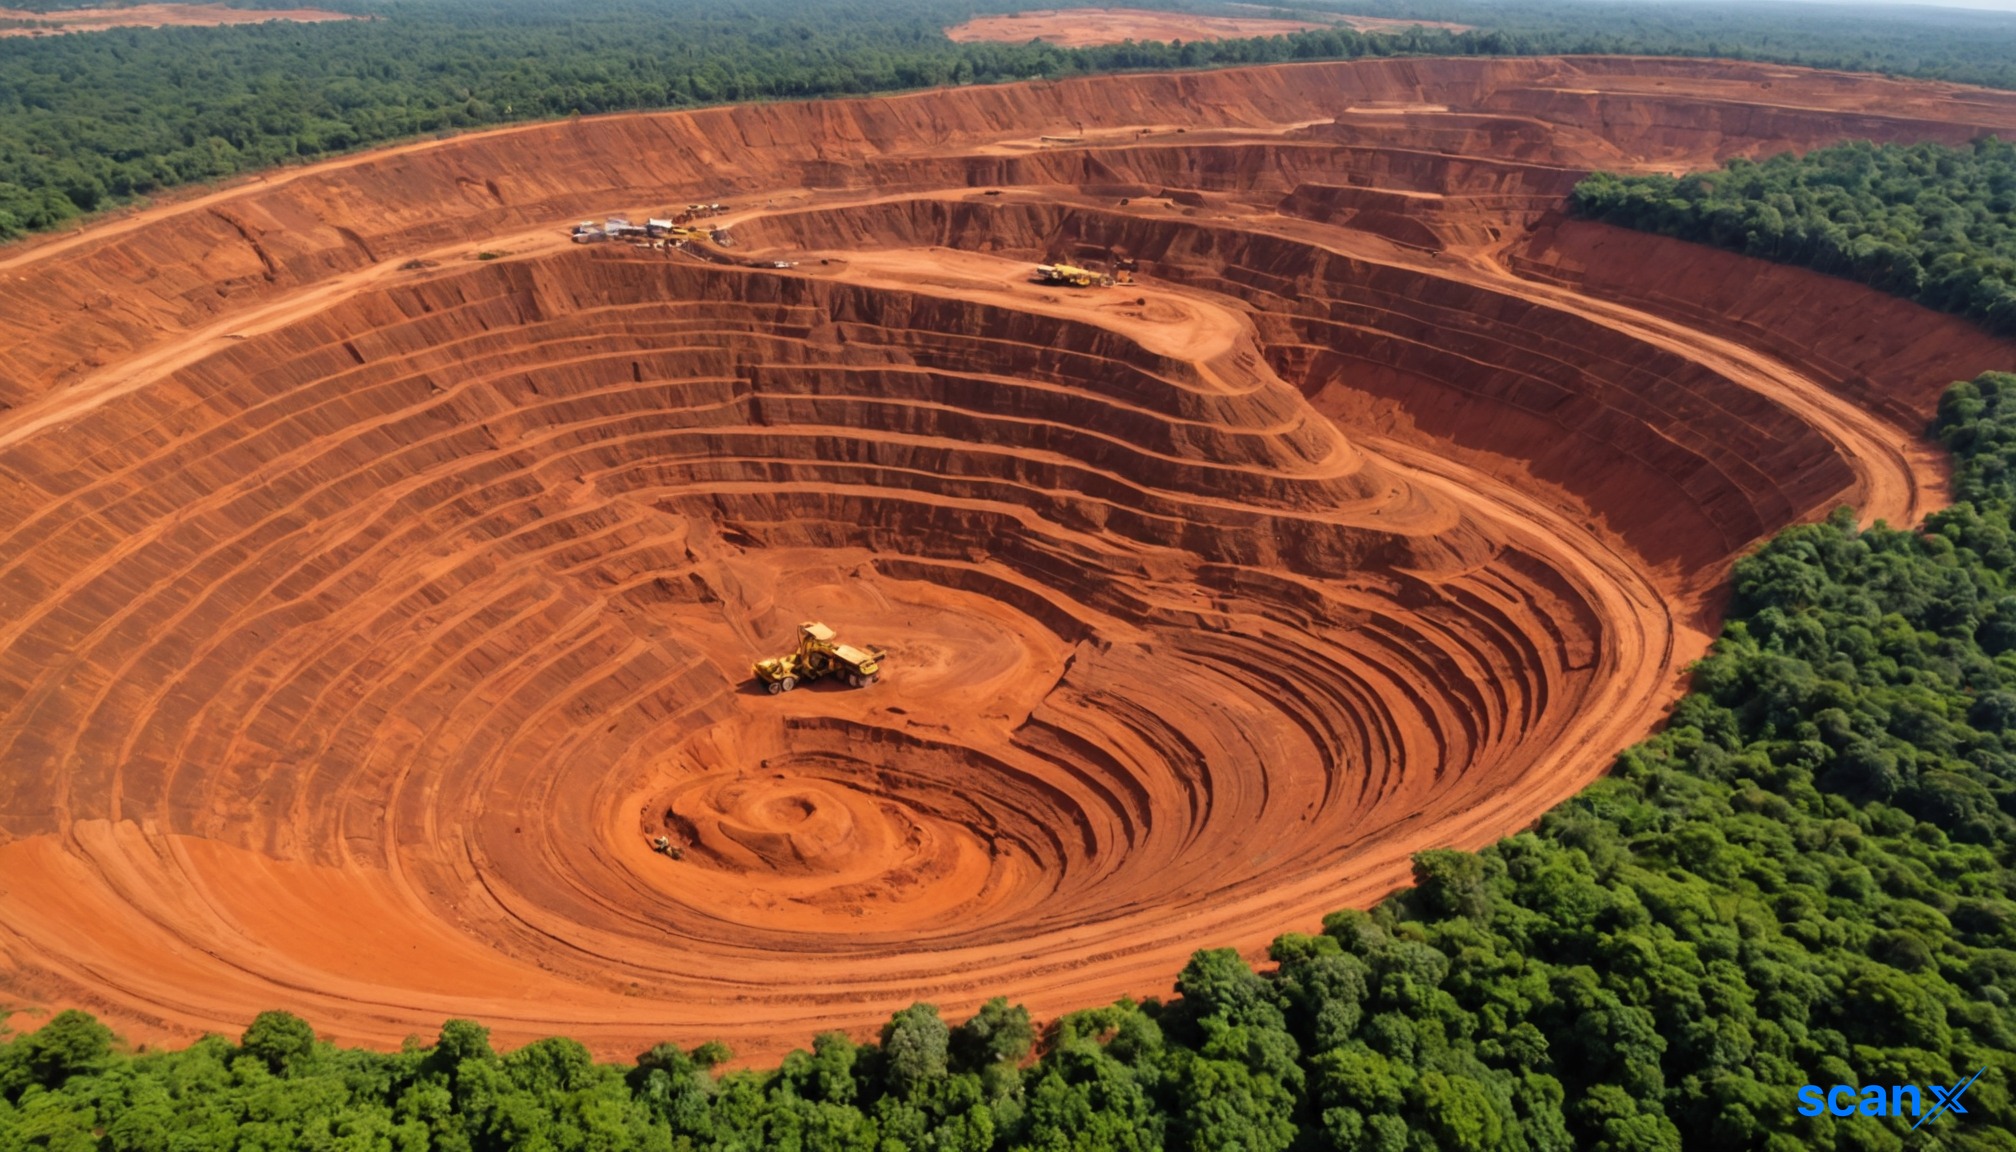
*this image is generated using AI for illustrative purposes only.
APL Apollo Tubes filed its Business Responsibility and Sustainability Report (BRSR) for FY26 on August 21, 2026. The report details the structural steel tube manufacturer's consolidated environmental, social, and governance performance for the financial year ended March 31, 2026.
The filing discloses significant progress in decarbonisation efforts, with renewable electricity accounting for 58% of total consumption, up from 31% in FY25. This shift contributed to a 33% reduction in Scope 2 greenhouse gas emissions compared to the previous year.
Environmental Performance
APL Apollo reported total energy consumption of 20,73,209 GJ in FY26, an increase from 18,61,840 GJ in FY25. Despite the higher absolute energy use, energy intensity per rupee of turnover remained stable at 89.8 GJ/INR Cr, unchanged from the prior year.
Water stewardship metrics showed improved efficiency. Total water withdrawal fell to 6,77,627 kiloliters from 7,79,783 kiloliters in FY25. Water intensity per rupee of turnover decreased to 27.6 KL/INR Cr from 32.3 KL/INR Cr. The company reported total water discharge of 39,824 kiloliters, a sharp decline from 110,700 kiloliters in FY25, supported by Zero Liquid Discharge (ZLD) implementation at 63% of its manufacturing facilities.
Emissions and Waste
Scope 1 emissions rose to 63,347 tCO2e from 56,455 tCO2e in FY25. However, Scope 2 emissions dropped significantly to 83,186 tCO2e from 1,24,341 tCO2e. Total Scope 1 and Scope 2 emission intensity per rupee of turnover fell to 6.3 tCO2e/INR Cr from 8.7 tCO2e/INR Cr.
Total waste generated increased to 1,55,311.6 metric tonnes from 1,43,644.0 metric tonnes. Of this, 1,55,301.0 metric tonnes were recovered through recycling, reuse, or other recovery operations. Only 10.6 metric tonnes were disposed of, compared to 124 metric tonnes in FY25.
What the Numbers Show
The divergence between rising Scope 1 emissions and falling Scope 2 emissions highlights the impact of APL Apollo's renewable energy procurement strategy. While operational fuel consumption drove a 12% increase in direct emissions, the aggressive shift to renewable electricity—reaching 92% at the Hosur plant and 80% at ABPL—cut indirect emissions by nearly one-third. This suggests that while production volumes or process intensities may have increased Scope 1 output, the company successfully decoupled its overall carbon intensity from revenue growth through grid-mix improvements.
Social and Governance Metrics
The company employed 1,165 permanent employees and 5,102 workers as of March 31, 2026. Female representation remained low at 3% among employees and 1% among workers. The Lost Time Injury Frequency Rate (LTIFR) for workers stood at 1.96 per million person-hours, down from 10.8 in FY25. Employee LTIFR was recorded at 0.0.
Sustainability Actions Private Limited provided reasonable assurance on BRSR Core disclosures and limited assurance on non-core indicators for the report.
Historical Stock Returns for APL Apollo Tubes
| 1 Day | 5 Days | 1 Month | 6 Months | 1 Year | 5 Years |
|---|---|---|---|---|---|
| -2.05% | -5.15% | -7.24% | +7.11% | +19.71% | +144.13% |

How will APL Apollo address the 12% rise in Scope 1 emissions, given that renewable electricity procurement has already maximized its impact on Scope 2 reductions?
What specific capital expenditures or technological upgrades are planned to accelerate the implementation of Zero Liquid Discharge at the remaining 37% of manufacturing facilities?
Given the low female representation (3% employees, 1% workers), what strategic initiatives will the company undertake to improve gender diversity in its workforce over the next fiscal year?
 17
17








 Create Custom Screeners
  Access 200+ Pre-built Filters
  Use 50+ Readymade Screener





