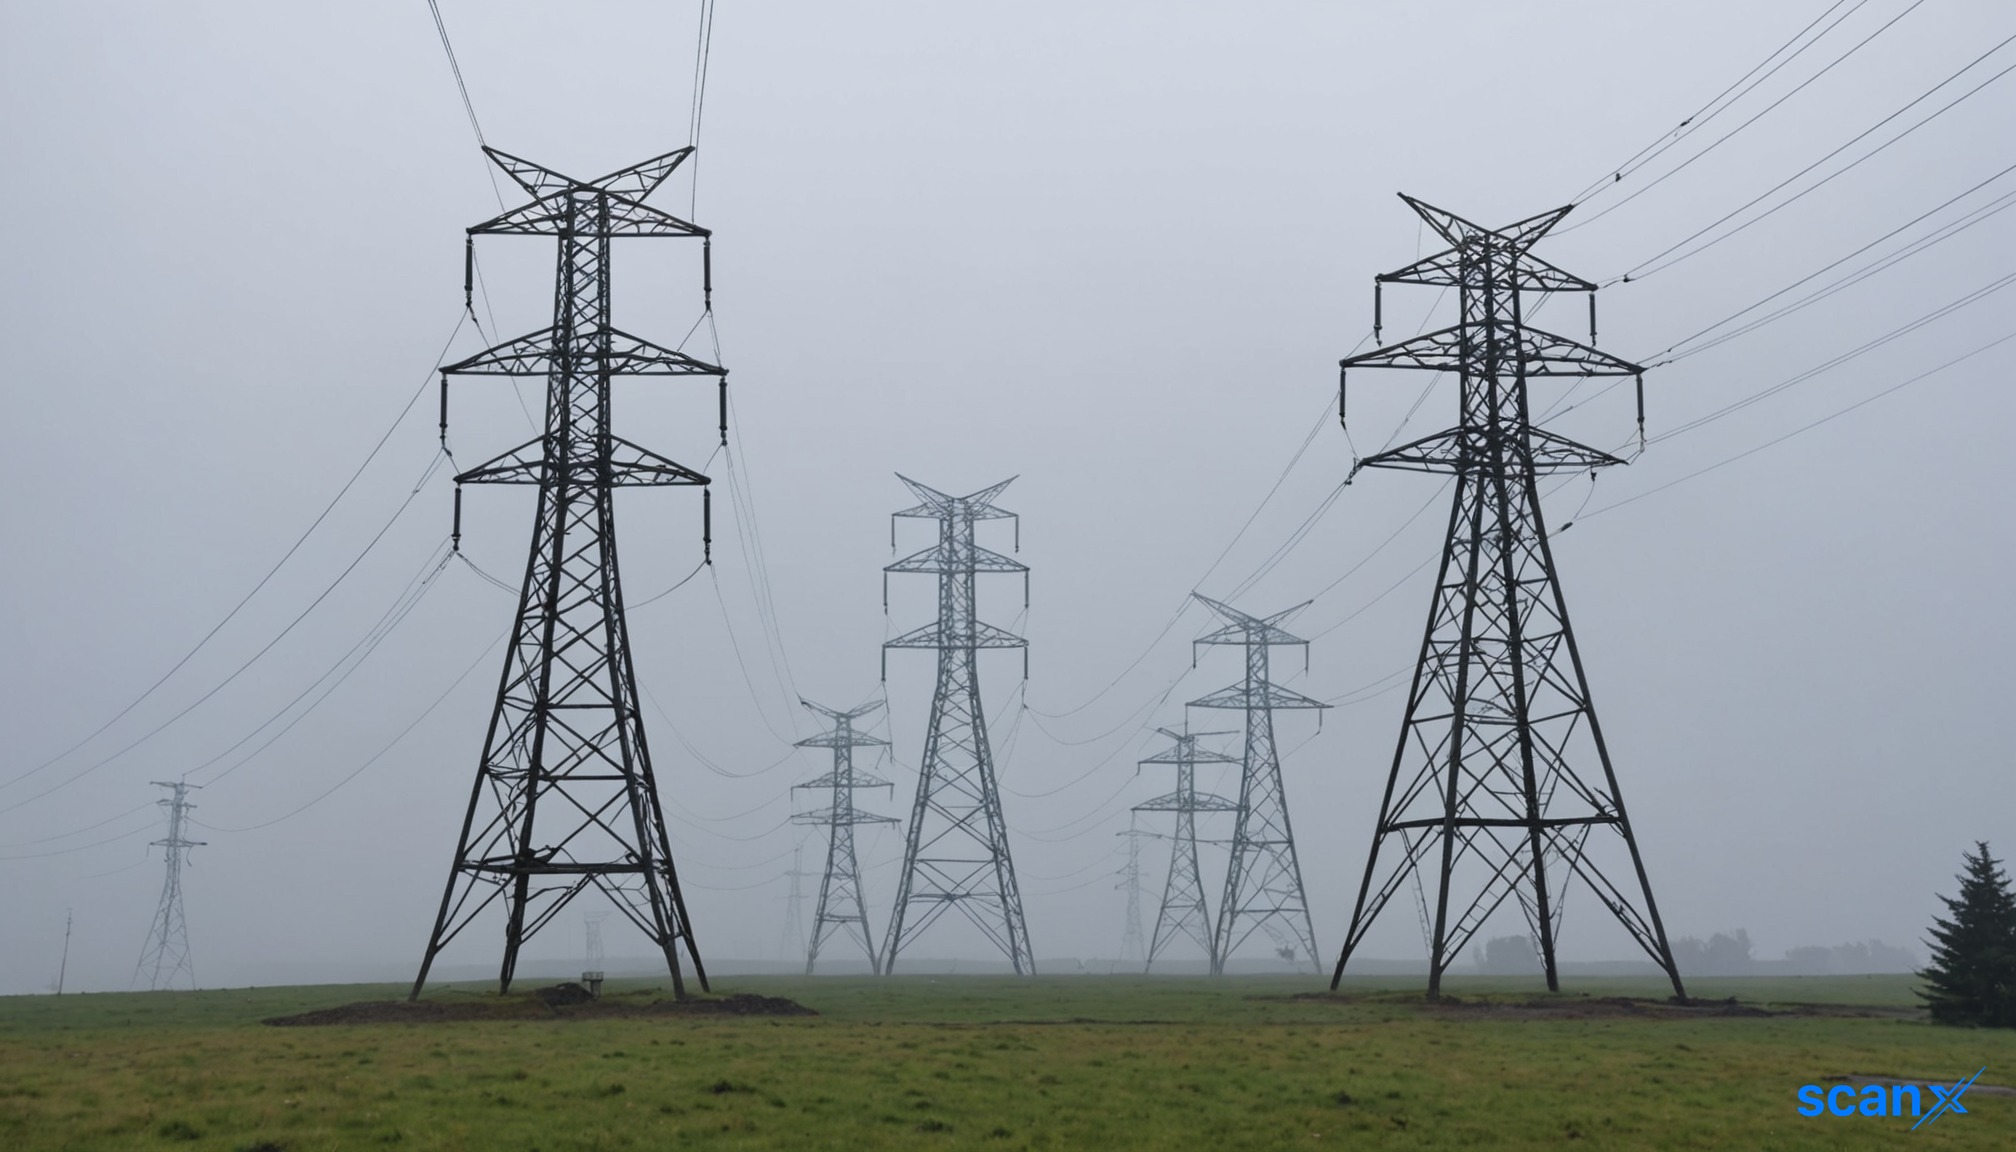
Oil shipping costs reach record highs amid Hormuz disruptions

scanx
Reviewed by
Ritika DScanX News Team
Key Highlights
  • Oil shipping costs reached record highs
  • Disruptions in the Strait of Hormuz drove the surge
  • Global energy logistics face increased pressure
powered bylight_fuzz_icon
52936298

*this image is generated using AI for illustrative purposes only.

Oil shipping costs have surged to dizzying new highs, driven by significant snarls in the Strait of Hormuz. This spike marks a critical escalation in global energy logistics expenses.

The sharp increase in freight rates highlights the vulnerability of key maritime chokepoints to geopolitical instability. Market participants are closely monitoring the situation as it impacts supply chain reliability and transportation budgets for crude oil exporters and importers alike.

Disclaimer: This article is AI-generated using data from ViewTrade. ScanX is not liable for any inaccuracies.

How might sustained high freight rates from Hormuz disruptions alter the long-term viability of alternative oil transport routes like the Cape of Good Hope?

What specific hedging strategies are crude oil importers likely to adopt to mitigate the impact of volatile shipping costs on their downstream margins?

Could prolonged snarls in the Strait of Hormuz accelerate investment in strategic petroleum reserves or non-seaborne energy infrastructure?

like19
dislike

US crude inventories fall 3.186M barrels, miss estimates

scanx
Reviewed by
Ritika DScanX News Team
Key Highlights
  • US crude oil inventories fell 3,186,000 barrels against an estimated build of 1,718,000 barrels
  • Previous week's inventory change was an increase of 922,000 barrels
  • Cushing crude oil inventories rose to 444,000 barrels from 553,000 barrels previously
powered bylight_fuzz_icon
52930907

*this image is generated using AI for illustrative purposes only.

US crude oil inventories declined by 3,186,000 barrels, significantly missing the market estimate of a 1,718,000 barrel build. This sharp drawdown contrasts with the previous week's data, which showed an increase of 922,000 barrels.

Inventory Data Breakdown

The latest energy market data highlights a divergence between total US crude stocks and those held in the Cushing, Oklahoma hub. While national inventories contracted, Cushing stocks saw a modest accumulation.

Metric Actual Previous Estimate
US Crude Oil Inventories -3,186K 922K 1,718K
Cushing Crude Oil Inventories 444K 553K N/A

What the Numbers Show

The actual figure for US crude oil inventories represents a swing of 4,108,000 barrels from the previous week's reported increase of 922,000 barrels. Furthermore, the actual drawdown of 3,186,000 barrels deviates from the consensus expectation of a 1,718,000 barrel build by 4,904,000 barrels, indicating a tighter supply picture than anticipated by analysts.

Disclaimer: This article is AI-generated using data from LiveSquawk. ScanX is not liable for any inaccuracies.

How might the significant divergence between national crude draws and Cushing builds influence regional price differentials in upcoming trading sessions?

What specific factors, such as refinery utilization rates or export volumes, are driving the unexpected sharp decline in total US crude inventories?

Could this substantial inventory drawdown prompt OPEC+ to reconsider its current production quotas to prevent excessive market tightening?

like19
dislike

More News on Crude Oil