Finolex Industries reports 25% OPM in Q4 FY26, EBITDA nearly doubles


Finolex Industries reported a 12% YoY revenue increase to INR1,314 crores in Q4 FY26, driven by improved realizations. EBITDA nearly doubled to INR332 crores, boosting OPM to 25%. For the full year, revenue was flat at INR4,113 crores, but EBITDA rose 43% to INR679 crores. Management cited inventory gains and procurement strategies for margin expansion, guiding for sub-15% EBITDA margins sustainably.

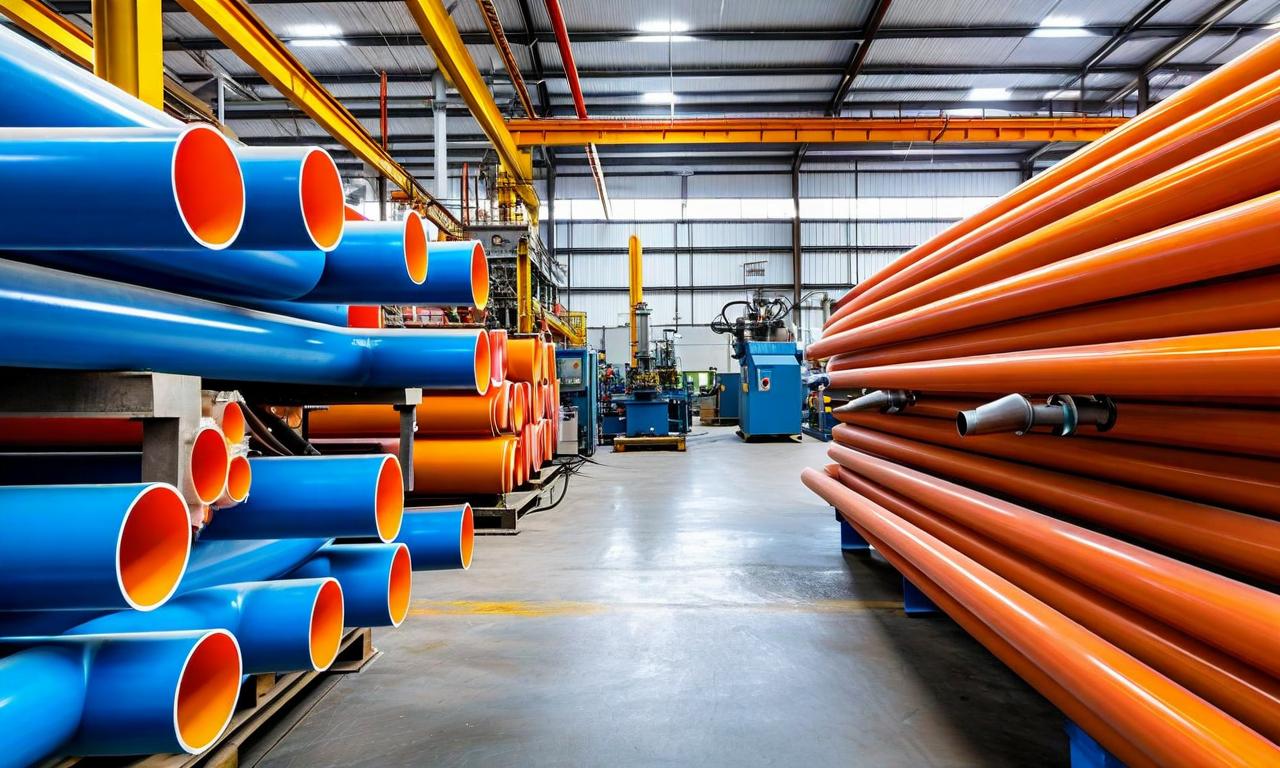
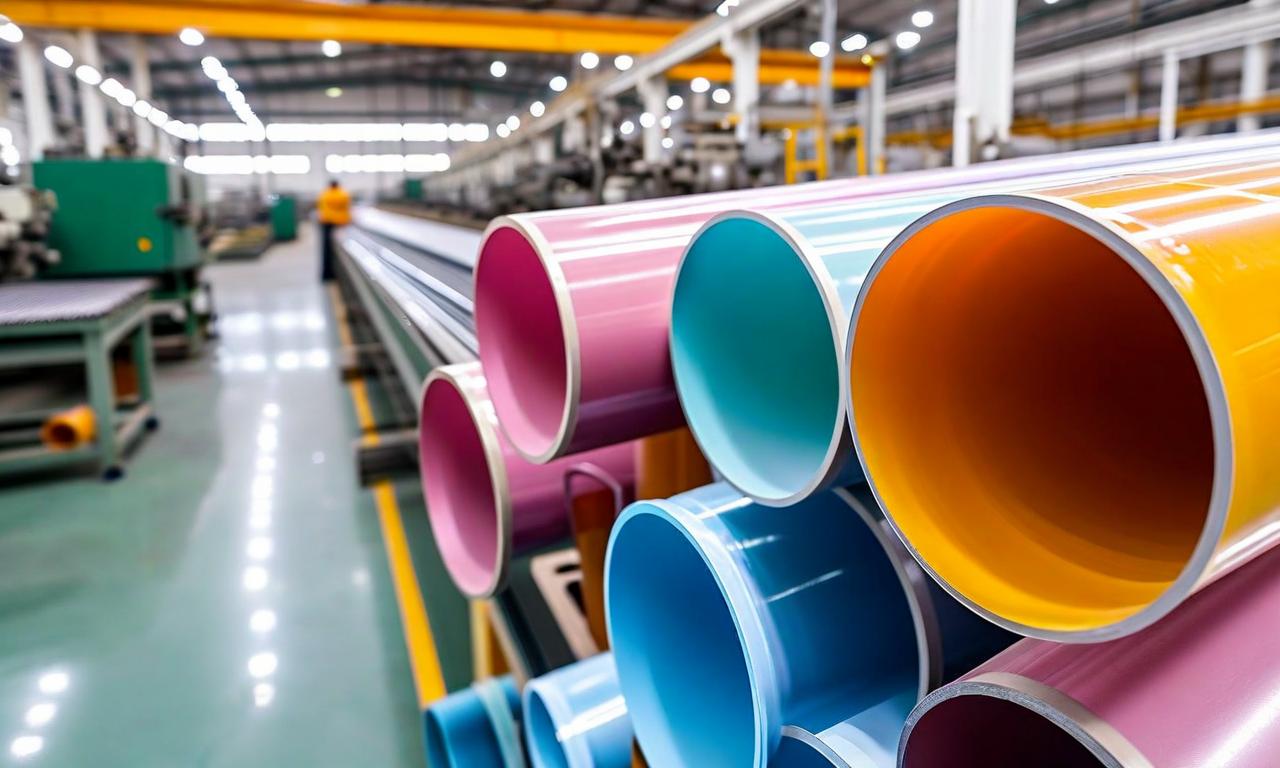
*this image is generated using AI for illustrative purposes only.
Finolex Industries reported a 12% year-on-year growth in revenue for Q4 FY26, which stood at INR1,314 crores compared to INR1,172 crores in Q4 FY25. The company delivered a strong profitability performance, with EBITDA nearly doubling to INR332 crores from INR171 crores in the previous year. Consequently, the operating profit margin (OPM) expanded significantly to 25% from 14.6% year-on-year. Profit before tax rose 65% to INR334 crores, while profit after tax increased to INR306 crores from INR144 crores in the corresponding period of the previous year.
Full Year Performance
For the full financial year 2025-26, Finolex Industries reported a flat revenue of INR4,113 crores against INR4,142 crores in FY25. The lower sales volumes during the year were offset by better realizations. EBITDA for the year increased 43% to INR679 crores, and EBIT grew 55% to INR572 crores. The sales volumes for the full year stood at 332,736 metric tons, a decline from 347,982 metric tons in the previous year. The company maintains a strong balance sheet with a net free cash of approximately INR2,563 crores.
Operational Metrics and Segment Mix
During Q4 FY26, volumes remained broadly flat at 101,772 tons compared to 102,253 tons in Q4 FY25. The agriculture segment accounted for approximately 63% of the mix in FY26, down from 67% in FY25, indicating a gradual shift towards non-agriculture segments. Management targets a more balanced 50-50 split between agri and non-agri segments over the next 4 to 5 years. The fittings share in total volume increased to 11% in FY26 from 10% in the previous year.
| Metric | Q4 FY26 | Q4 FY25 | FY26 | FY25 |
|---|---|---|---|---|
| Revenue (INR crores) | 1,314 | 1,172 | 4,113 | 4,142 |
| EBITDA (INR crores) | 332 | 171 | 679 | — |
| OPM (%) | 25 | 14.6 | — | — |
| PBT (INR crores) | 334 | 203 | — | — |
| PAT (INR crores) | 306 | 144 | — | — |
| Volume (tons) | 101,772 | 102,253 | 332,736 | 347,982 |
Outlook and Strategy
Management attributed the margin expansion to a combination of improved procurement strategies, better realizations due to geopolitical factors impacting polymer prices, and inventory gains estimated between INR35 crores and INR40 crores during the quarter. While the current EBITDA margins are elevated, the company guided for a sustainable range of sub-15% on a full-year basis, citing market volatility. Regarding capital allocation, the company continues to incur maintenance capex of roughly INR100 crores annually and is exploring options to utilize its significant cash reserves, having declared a dividend of INR2.75 per share for the current year.
Historical Stock Returns for Finolex Industries
| 1 Day | 5 Days | 1 Month | 6 Months | 1 Year | 5 Years |
|---|---|---|---|---|---|
| -0.90% | -1.37% | -8.37% | -5.71% | -20.31% | -7.50% |
What specific capital allocation strategies is the company considering to utilize its INR2,563 crore cash reserves beyond the current dividend payout?
How will the company drive the shift from a 63% agriculture mix to a 50-50 split between agri and non-agri segments over the next 4 to 5 years?
What measures will management implement to maintain profitability if polymer prices stabilize and inventory gains diminish?
 20
20