

How to evaluate companies building new economies


Investors should evaluate companies building new economic foundations by examining their architectural capital, invisible assets, and role in future economies rather than just current valuation metrics.


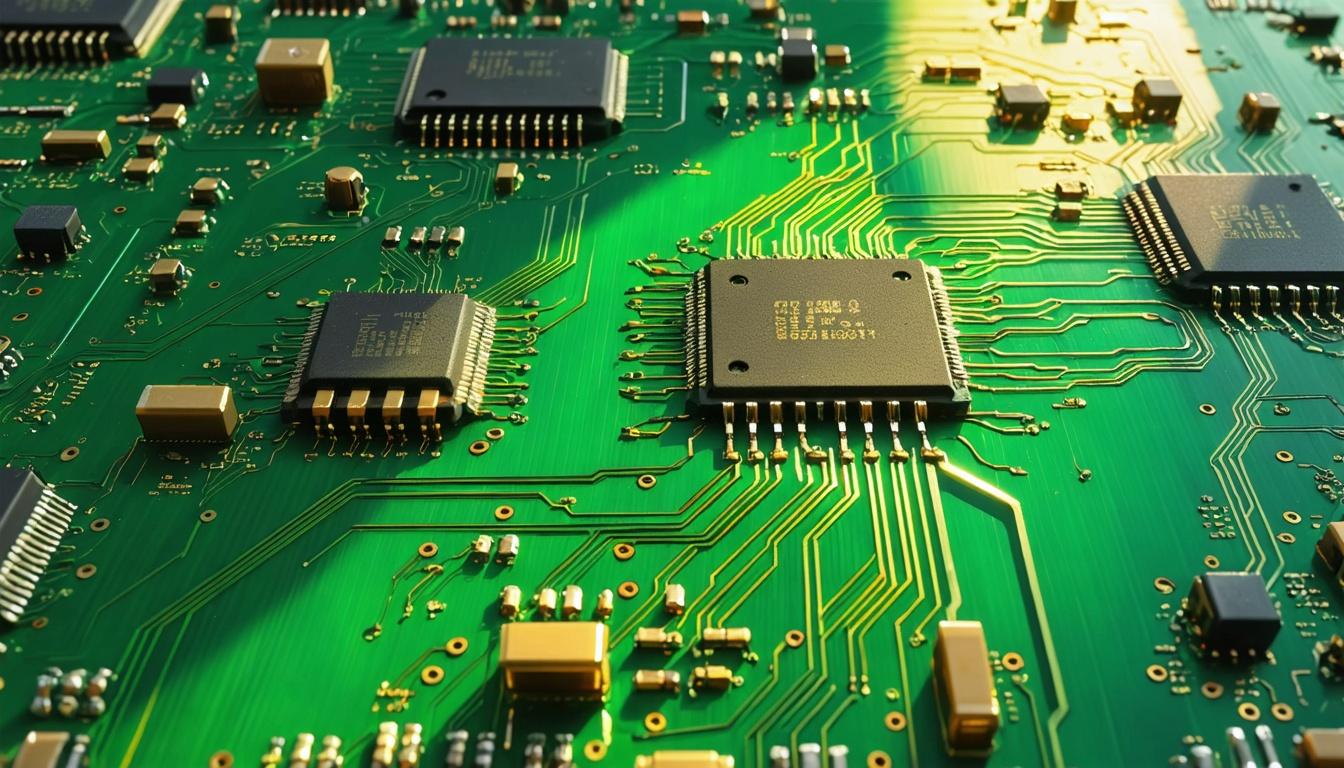
*this image is generated using AI for illustrative purposes only.
Recent debates over NVIDIA's valuation raise larger questions about computational architecture, competitive advantage, and the future of intelligent infrastructure. While financial markets focus on visible events like earnings reports and product launches, history suggests these represent the visible consequences of changes that began many years earlier. The key question for thoughtful long-term investors is not simply which companies produce impressive products today, but which organizations are becoming indispensable to the economies of tomorrow.
The Headlines Are Not the Stories
Financial markets naturally focus on visible events. Earnings reports, analyst upgrades, product launches, quarterly guidance, and valuation changes dominate daily headlines because they move prices. However, history suggests they represent the visible consequences of changes that began many years earlier. Organizations do not become influential because of a single breakthrough or fortunate market opportunity. Their long-term success usually reflects years of disciplined architectural decisions that accumulated before attracting widespread attention.
Why Analysts Describe NVIDIA as Compelling Value
The recent discussion suggesting that NVIDIA may represent compelling value compared with companies such as Apple, Microsoft, and Meta deserves thoughtful consideration. The recent argument centered on the observation that NVIDIA's earnings have grown so rapidly that, despite its extraordinary market capitalization, certain valuation measures are comparable to, or even lower than, those of several other large technology companies. Markets appear to be asking whether companies building foundational AI infrastructure should be evaluated differently from companies primarily monetizing mature digital ecosystems.
| Company | Primary Role |
|---|---|
| Apple | Consumer ecosystems |
| Microsoft | Enterprise software, cloud, productivity, AI |
| Meta | Digital communication, advertising, immersive tech |
| NVIDIA | Computational infrastructure for AI |
Products Generate Revenue, But Infrastructure Creates Dependence
Products solve immediate customer problems and generate commercial revenue. However, infrastructure enables entire industries to develop new capabilities that extend far beyond the original product itself. The Industrial Revolution did not become transformative because of one exceptional steam engine. It changed civilization because transportation, manufacturing, engineering, finance, and trade gradually reorganized around entirely new infrastructure. Similar patterns later emerged with electricity, telecommunications, gas, semiconductor manufacturing, cloud computing, and the internet.
The Invisible Assets Most Balance Sheets Never Capture
Traditional financial analysis remains indispensable. Revenue growth, profitability, free cash flow, margins, and return on invested capital continue to provide important indicators of business performance. Yet some of the most valuable assets that influence long-term competitiveness rarely appear directly in financial statements. Developer communities, research partnerships, educational adoption, trusted leadership, enterprise relationships, intellectual capital, software ecosystems, technical standards, organizational knowledge, and customer confidence require decades to develop. Collectively, they create what is described as architectural capital.
Five Questions for Long-Term Investors
Rather than asking whether a company appears expensive or inexpensive today, it is useful to ask a different set of questions that focus on long-term capability.
- Does the organization primarily sell products, or does it enable entirely new industries to emerge?
- Is management building for the next earnings cycle, or for the next technological era?
- Can competitors realistically replace the company's technology, or would they also need to replicate its ecosystem, developer community, partnerships, educational presence, and accumulated trust?
- Does future value depend mainly upon demand, or upon growing dependency?
- If the organization disappeared tomorrow, which parts of the broader economy would struggle to function?
Reading Between the Lines of the Intelligence Economy
Artificial intelligence has understandably captured global attention through conversational systems, intelligent agents, robotics, autonomous vehicles, scientific discovery, and healthcare innovation. Entire industries are gradually reorganizing around computational infrastructure that supports continuous learning, simulation, optimization, collaboration, and intelligent decision-making. The organizations that build critical infrastructure may therefore influence future economic development in ways that extend far beyond today's market expectations.

How will the distinction between product-focused and infrastructure-focused companies influence M&A activity in the AI sector over the next decade?
Could the rapid accumulation of 'architectural capital' by current leaders create insurmountable barriers to entry for new startups?
How might regulatory frameworks evolve to address the dominance of companies that control foundational computational infrastructure?
 16
16











 Create Custom Screeners
  Access 200+ Pre-built Filters
  Use 50+ Readymade Screener





