

Tata Motors PV August sales rise 56% YoY; EV volume up 94%


- Total August sales reached 67,753 units, a 56% YoY increase from 43,315 units
- Domestic PV sales surged 59% to 65,253 units, driving overall growth
- EV volumes jumped 94% YoY to 16,549 units across domestic and IB markets
- International business sales rose 8% to 2,500 units
- Results missed analyst estimates of 70,000 units despite strong YoY gains



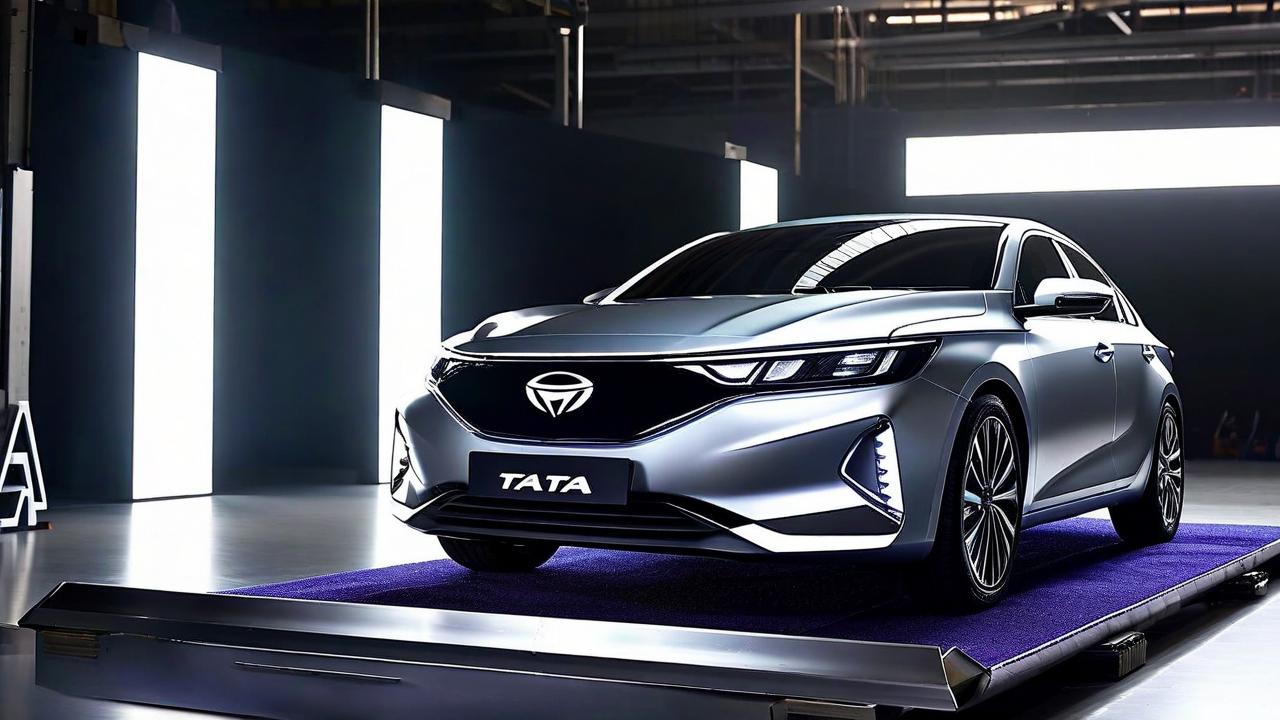
*this image is generated using AI for illustrative purposes only.
Tata Motors Passenger Vehicles reported August total sales of 67,753 units, up from 43,315 units in the same month a year ago, though the figure came in below the analyst estimate of 70,000 units.
Sales performance at a glance
The year-on-year improvement reflects a significant volume increase for the passenger vehicles segment. The following table captures the key sales metrics for the period:
| Metric | August (Current Year) | August (YoY) | Estimate |
|---|---|---|---|
| Total sales (units) | 67,753 | 43,315 | 70,000 |
| EV domestic + IB (units) | 16,549 | 8,540 | - |
| PV Domestic (units) | 65,253 | 41,001 | - |
| PV IB (units) | 2,500 | 2,314 | - |
Segment-wise breakdown
Domestic passenger vehicle sales drove the majority of the growth, rising 59% to 65,253 units from 41,001 units in August last year. International business (IB) sales saw a more modest increase of 8%, reaching 2,500 units compared to 2,314 units previously.
What the numbers show
Tata Motors Passenger Vehicles delivered a strong year-on-year volume recovery, with total sales rising from 43,315 units to 67,753 units. However, the actual sales figure fell short of the market estimate of 70,000 units, indicating that while growth was substantial on a YoY basis, the segment did not fully meet expectations for the month.
Electric vehicle momentum remained robust, with domestic and internal business (IB) EV sales reaching 16,549 units, a 94% increase from 8,540 units in August last year. This sharp acceleration in EV volumes contributed significantly to the overall passenger vehicle growth trajectory.
The data indicates that domestic demand is the primary engine of growth, accounting for approximately 96% of total sales volume, while international operations provide a stable but slower-growing contribution.
Historical Stock Returns for Tata Motors Passenger Vehicles
| 1 Day | 5 Days | 1 Month | 6 Months | 1 Year | 5 Years |
|---|---|---|---|---|---|
| -1.45% | -7.02% | -12.52% | -5.67% | -32.15% | +38.45% |

How might the shortfall against the 70,000-unit estimate impact Tata Motors' stock valuation and investor sentiment in the near term?
What specific strategies is Tata Motors pursuing to accelerate international business sales beyond the current modest 8% growth rate?
Will the rapid 94% surge in EV sales strain supply chain capabilities or require significant capital expenditure adjustments in upcoming quarters?
 18
18









 Create Custom Screeners
  Access 200+ Pre-built Filters
  Use 50+ Readymade Screener





