

Tanfac Industries submits FY26 BRSR report with ESG metrics


- Tanfac Industries filed its FY26 BRSR report with BSE on September 1, 2026
- Total energy consumption rose to 5,74,354 GJ with 70,562 GJ from renewable sources
- GHG emissions increased to 50,733.55 tCO2e from 35,154 tCO2e in FY25
- Employee LTIFR dropped to 0 while worker LTIFR fell to 0.579
- Well-being spending declined to 0.10% of revenue from 4.11% previously



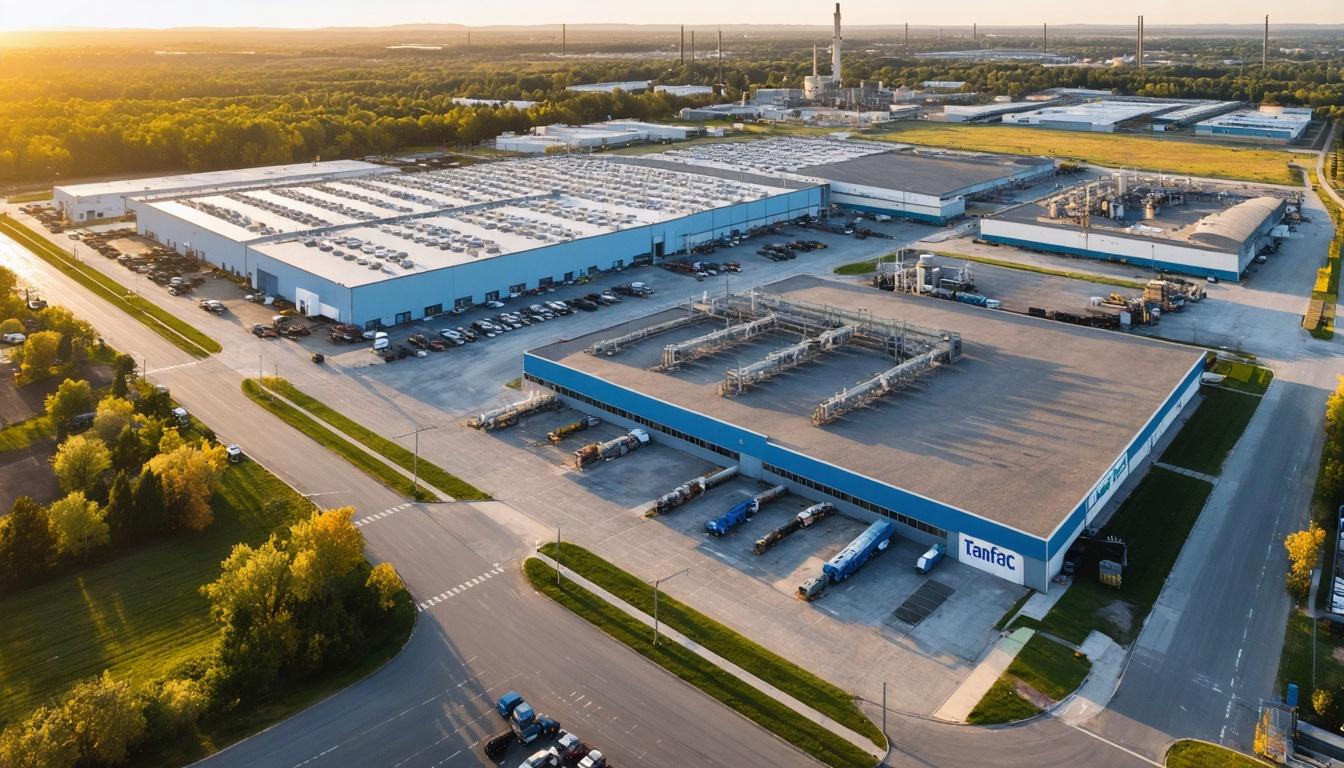
*this image is generated using AI for illustrative purposes only.
Tanfac Industries submitted its Business Responsibility and Sustainability Report (BRSR) for FY26 to the Bombay Stock Exchange on September 1, 2026. The filing details the company's environmental, social, and governance disclosures for the financial year ending March 31, 2026.
The report covers the company's standalone operations in fluorine-based chemical manufacturing. It includes data on energy consumption, water usage, waste management, and employee welfare. The disclosures were prepared in accordance with SEBI's BRSR framework.
Environmental Performance
The company reported total energy consumption of 5,74,354 GJ for FY26, up from 4,42,343 GJ in the previous year. Renewable energy consumption increased significantly, with 70,562 GJ sourced from renewable sources compared to nil in FY25. Total greenhouse gas emissions (Scope 1 and 2) stood at 50,733.55 tCO2e, rising from 35,154 tCO2e in FY25.
Water withdrawal totaled 6,44,283 kiloliters, primarily from third-party sources. The company discharged 73,758.7 kiloliters of treated effluent. Waste generation rose to 2,969.62 metric tonnes from 1,699 metric tonnes in the prior year.
| Environmental Metric | FY26 | FY25 |
|---|---|---|
| Total Energy Consumption (GJ) | 5,74,354 | 4,42,343 |
| Renewable Energy (GJ) | 70,562 | Nil |
| GHG Emissions Scope 1+2 (tCO2e) | 50,733.55 | 35,154 |
| Water Withdrawal (KL) | 6,44,283 | 5,73,755 |
| Total Waste Generated (MT) | 2,969.62 | 1,699 |
Safety and Employee Welfare
The company recorded a Lost Time Injury Frequency Rate (LTIFR) of 0 for employees and 0.579 for workers in FY26. This compares to an LTIFR of 1.35 for employees and 0.67 for workers in FY25. There were no fatalities among employees or workers during the current fiscal year.
Spending on employee well-being measures was 0.10% of total revenue, down from 4.11% in the previous year. The company employs 182 permanent employees and 436 workers. Training coverage reached 100% for all permanent employees on health, safety, and skill upgradation.
What the Numbers Show
While total energy consumption and GHG emissions rose alongside higher operational activity, the share of renewable energy in the mix expanded from zero to approximately 12.3% of total consumption. This shift coincided with a reduction in energy intensity per unit of physical output, which fell from 0.00371 in FY25 to 0.0023958 in FY26, indicating improved operational efficiency despite higher absolute usage.
Historical Stock Returns for TANFAC Industries
| 1 Day | 5 Days | 1 Month | 6 Months | 1 Year | 5 Years |
|---|---|---|---|---|---|
| +2.23% | +11.46% | +2.27% | +49.65% | +69.01% | 0.0% |

How does Tanfac Industries plan to accelerate its renewable energy adoption beyond the current 12.3% share to meet long-term decarbonization targets?
What specific operational changes or capital expenditures drove the significant reduction in energy intensity despite a 30% increase in total energy consumption?
Given the sharp decline in employee well-being spending from 4.11% to 0.10%, what strategic shifts in HR policy or cost management are anticipated for FY27?
 18
18













 Access Market Heat-map & Insights
  Create, Save & Share your Screener
  Use 200+ Screening Filters





