

Tanfac Industries publishes Q1 FY27 results in newspapers after Board approval


Tanfac Industries confirmed its Q1 FY27 results via newspaper publication on July 25, 2026, after Board approval on July 24. The results show revenue rising 6.3% YoY to ₹187.2 crore, while PAT fell 13.4% to ₹16.8 crore due to higher Sulphur costs. The company remains net debt-free following recent capital raises.

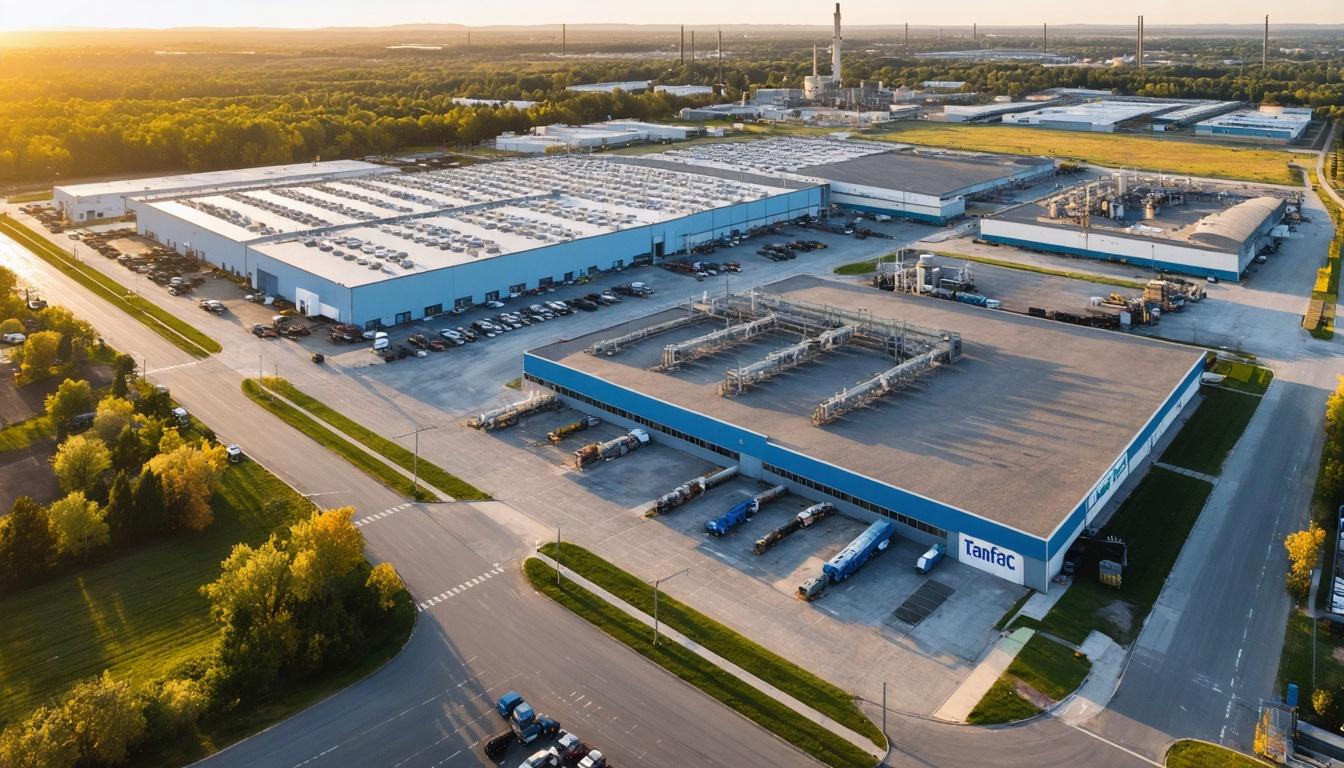

*this image is generated using AI for illustrative purposes only.
Tanfac Industries published its unaudited financial results for the quarter ended June 30, 2026 (Q1 FY27) in newspapers on July 25, 2026, confirming regulatory compliance under the SEBI (Listing Obligations and Disclosure Requirements) Regulations, 2015. The disclosure follows the approval of the financial statements by the company's Board of Directors at a meeting held on July 24, 2026, based on recommendations from the Audit Committee. This procedural update validates the previously reported operational figures, ensuring transparency for investors regarding the company's performance amidst geopolitical headwinds.
The newspaper advertisements were placed in Business Standard (English) and Makkal Kural (Tamil), as required by Regulation 30 and Regulation 47 of the SEBI LODR Regulations. Vinod Kumar Srinivasan, Company Secretary and Compliance Officer, signed the communication to the BSE Limited, enclosing the proofs of publication. The results reflect a quarter where revenue grew but profitability faced pressure from input cost inflation.
Financial Performance Recap
As detailed in the approved results, Tanfac Industries reported a 6.3% year-on-year revenue increase to ₹187.2 crore in Q1 FY27. This growth was driven by higher capacity utilization and increased contribution from its Solar Grade Dihydrogen Fluoride (DHF) segment. However, profit after tax (PAT) contracted 13.4% to ₹16.8 crore from ₹19.4 crore in the corresponding period last year. The decline in PAT was attributed to elevated raw material costs, particularly Sulphur prices, and geopolitical tensions in West Asia that pressured margins.
| Particulars (₹ in Crores): | Q1 FY27 | Q1 FY26 | Q4 FY26 |
|---|---|---|---|
| Revenue from Operations: | 187.2 | 176.0 | 193.1 |
| Gross Profit: | 68.9 | 67.2 | 70.0 |
| Operating EBITDA: | 28.6 | 29.0 | 30.3 |
| Operating EBITDA Margin (%): | 15.27% | 16.46% | 15.7% |
| Profit Before Tax (PBT): | 23.8 | 24.6 | 25.0 |
| Profit After Tax (PAT): | 16.8 | 19.4 | 18.0 |
| PAT Margin (%): | 9.0% | 11.0% | 9.3% |
Operating EBITDA margin compressed to 15.27% from 16.46% in Q1 FY26. Gross profit remained relatively stable at ₹68.9 crore, slightly up from ₹67.2 crore in Q1 FY26 but down from ₹70.0 crore in Q4 FY26. The sequential decline in revenue was linked to temporary demand disruptions arising from the geopolitical situation in West Asia.
Strategic Capital Raise and Expansion
Managing Director Afzal Malkani highlighted the successful completion of a ₹250 crore Qualified Institutional Placement (QIP) and a proposed preferential issue of ~₹100 crore led by promoter Anupam Rasayan India Limited. These initiatives have transformed the company's balance sheet, rendering Tanfac Industries net debt-free. The proceeds will primarily fund the 20,000 MTPA HFC-32 refrigerant gas project, with a total investment of approximately ₹390 crore. The project is on track for commissioning by the end of Q3 FY27.
What the Numbers Show
The divergence between revenue growth and profitability contraction highlights the sensitivity of Tanfac's margins to raw material input costs, particularly Sulphur. While revenue grew 6.3% YoY, PAT declined 13.4%, indicating that cost inflation has outpaced pricing power in the short term. However, the gross profit stability suggests that operational efficiency and capacity utilization gains are partially offsetting these headwinds. The company's move to become net debt-free provides a financial buffer to navigate these transitional periods while investing in high-margin downstream products like HFC-32.
Historical Stock Returns for TANFAC Industries
| 1 Day | 5 Days | 1 Month | 6 Months | 1 Year | 5 Years |
|---|---|---|---|---|---|
| -5.68% | +3.20% | -6.41% | +37.73% | +71.58% | +860.61% |

How will the upcoming commissioning of the HFC-32 refrigerant gas project impact Tanfac Industries' revenue mix and margin profile in FY28?
What hedging strategies or long-term supply contracts is Tanfac employing to mitigate future volatility in Sulphur prices?
To what extent could sustained geopolitical tensions in West Asia disrupt the global supply chain for Solar Grade DHF, affecting Tanfac's export volumes?
 19
19








 Create Custom Screeners
  Access 200+ Pre-built Filters
  Use 50+ Readymade Screener





