

SPL Industries FY26 net profit falls to Rs 706.10 lakh


SPL Industries reported a standalone net profit of Rs 706.10 lakh for FY26, down from Rs 979.15 lakh in the previous year, as total revenue declined to Rs 8,878.11 lakh. The company cited challenging market conditions and subdued demand for the performance and decided not to declare a dividend for the year.


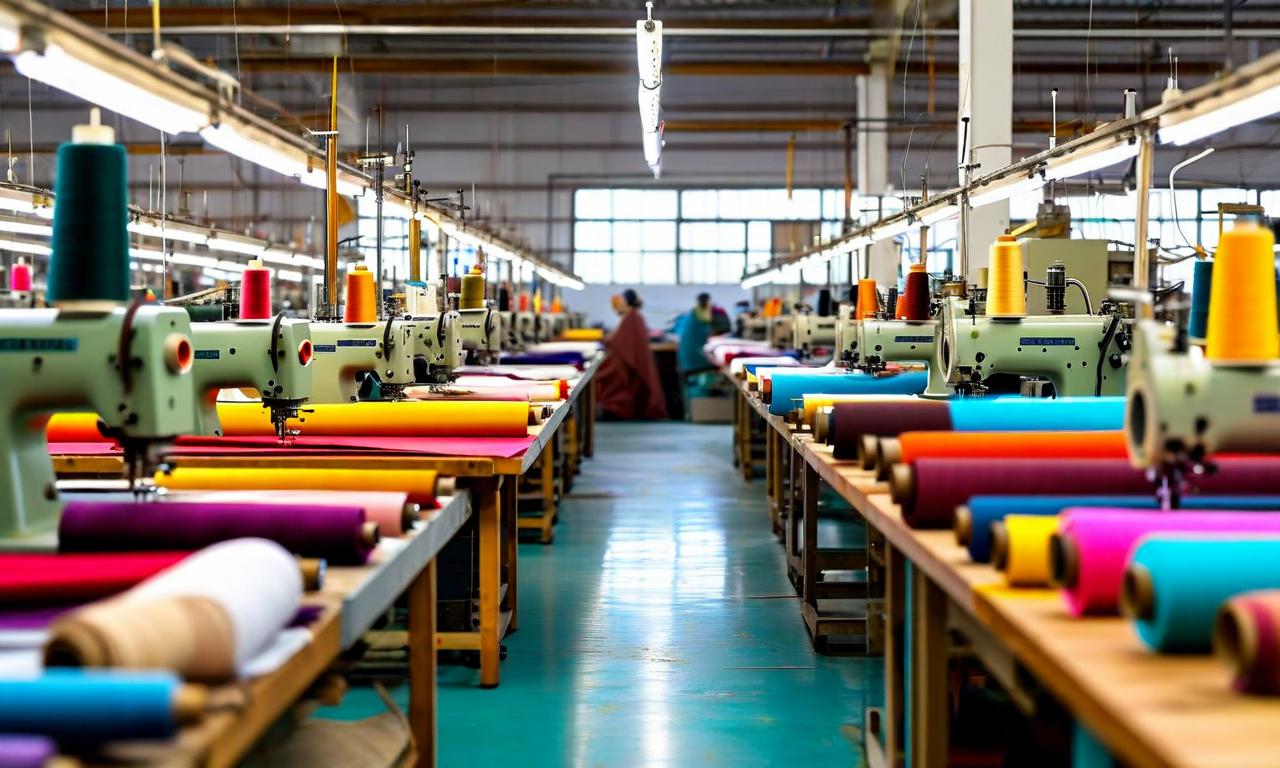
*this image is generated using AI for illustrative purposes only.
SPL Industries reported a standalone net profit of Rs 706.10 lakh for the financial year ended March 31, 2026, a decrease from Rs 979.15 lakh in the previous year. Total revenue for the period stood at Rs 8,878.11 lakh, compared to Rs 15,319.61 lakh in FY25, as the company navigated challenging market conditions in the textile industry.
The company attributed the decline in financial performance to subdued domestic and export demand, pricing pressures, and geopolitical uncertainties affecting global trade. Despite the revenue contraction, the board has decided not to declare any dividend for the financial year 2025-26 to conserve resources.
Financial Performance
On a standalone basis, revenue from operations decreased to Rs 6,954.01 lakh from Rs 13,942.23 lakh in the prior year. Other income rose to Rs 1,924.10 lakh from Rs 1,377.38 lakh. The profit before tax stood at Rs 609.94 lakh, down from Rs 1,295.24 lakh in FY25. The earnings per share (EPS) for the reporting year was Rs 2.43.
| Particulars | FY26 (Rs in Lakhs) | FY25 (Rs in Lakhs) |
|---|---|---|
| Revenue from Operations | 6,954.01 | 13,942.23 |
| Other Income | 1,924.10 | 1,377.38 |
| Total Revenue | 8,878.11 | 15,319.61 |
| Net Profit | 706.10 | 979.15 |
| Earnings Per Share | 2.43 | 3.38 |
Operational Highlights
The company noted that the financial year was marked by volatile raw material prices and increased competition from low-cost manufacturing countries. Management stated that despite the lower profitability, the company remains financially strong and focused on operational efficiency and cost management to create long-term shareholder value.
The paid-up equity share capital as of March 31, 2026, was Rs 29.00 crore, consisting of 2,90,00,004 equity shares of Rs 10 each fully paid-up. The company’s equity shares are listed on BSE Limited and the National Stock Exchange of India Limited.
Historical Stock Returns for SPL Industries
| 1 Day | 5 Days | 1 Month | 6 Months | 1 Year | 5 Years |
|---|---|---|---|---|---|
| -2.53% | -5.60% | -13.98% | +32.56% | -26.11% | -39.17% |

What specific strategies is management implementing to counteract competition from low-cost manufacturing countries?
How does the company plan to utilize the conserved resources from the dividend suspension to drive future growth?
Are there early indicators suggesting a recovery in domestic and export demand for the upcoming fiscal year?
 18
18








 Access Market Heat-map & Insights
  Create, Save & Share your Screener
  Use 200+ Screening Filters





