

Shalimar Wires net profit jumps 117% in Q1FY27 on inventory credit


Shalimar Wires Industries posted a 117% YoY increase in net profit to ₹219.75 lacs for Q1FY27, supported by ₹3,739.46 lacs in revenue. The profit surge was aided by a substantial inventory credit of ₹375.64 lacs, offsetting higher material and finance costs. Promoter pledge remains at 45.03%.


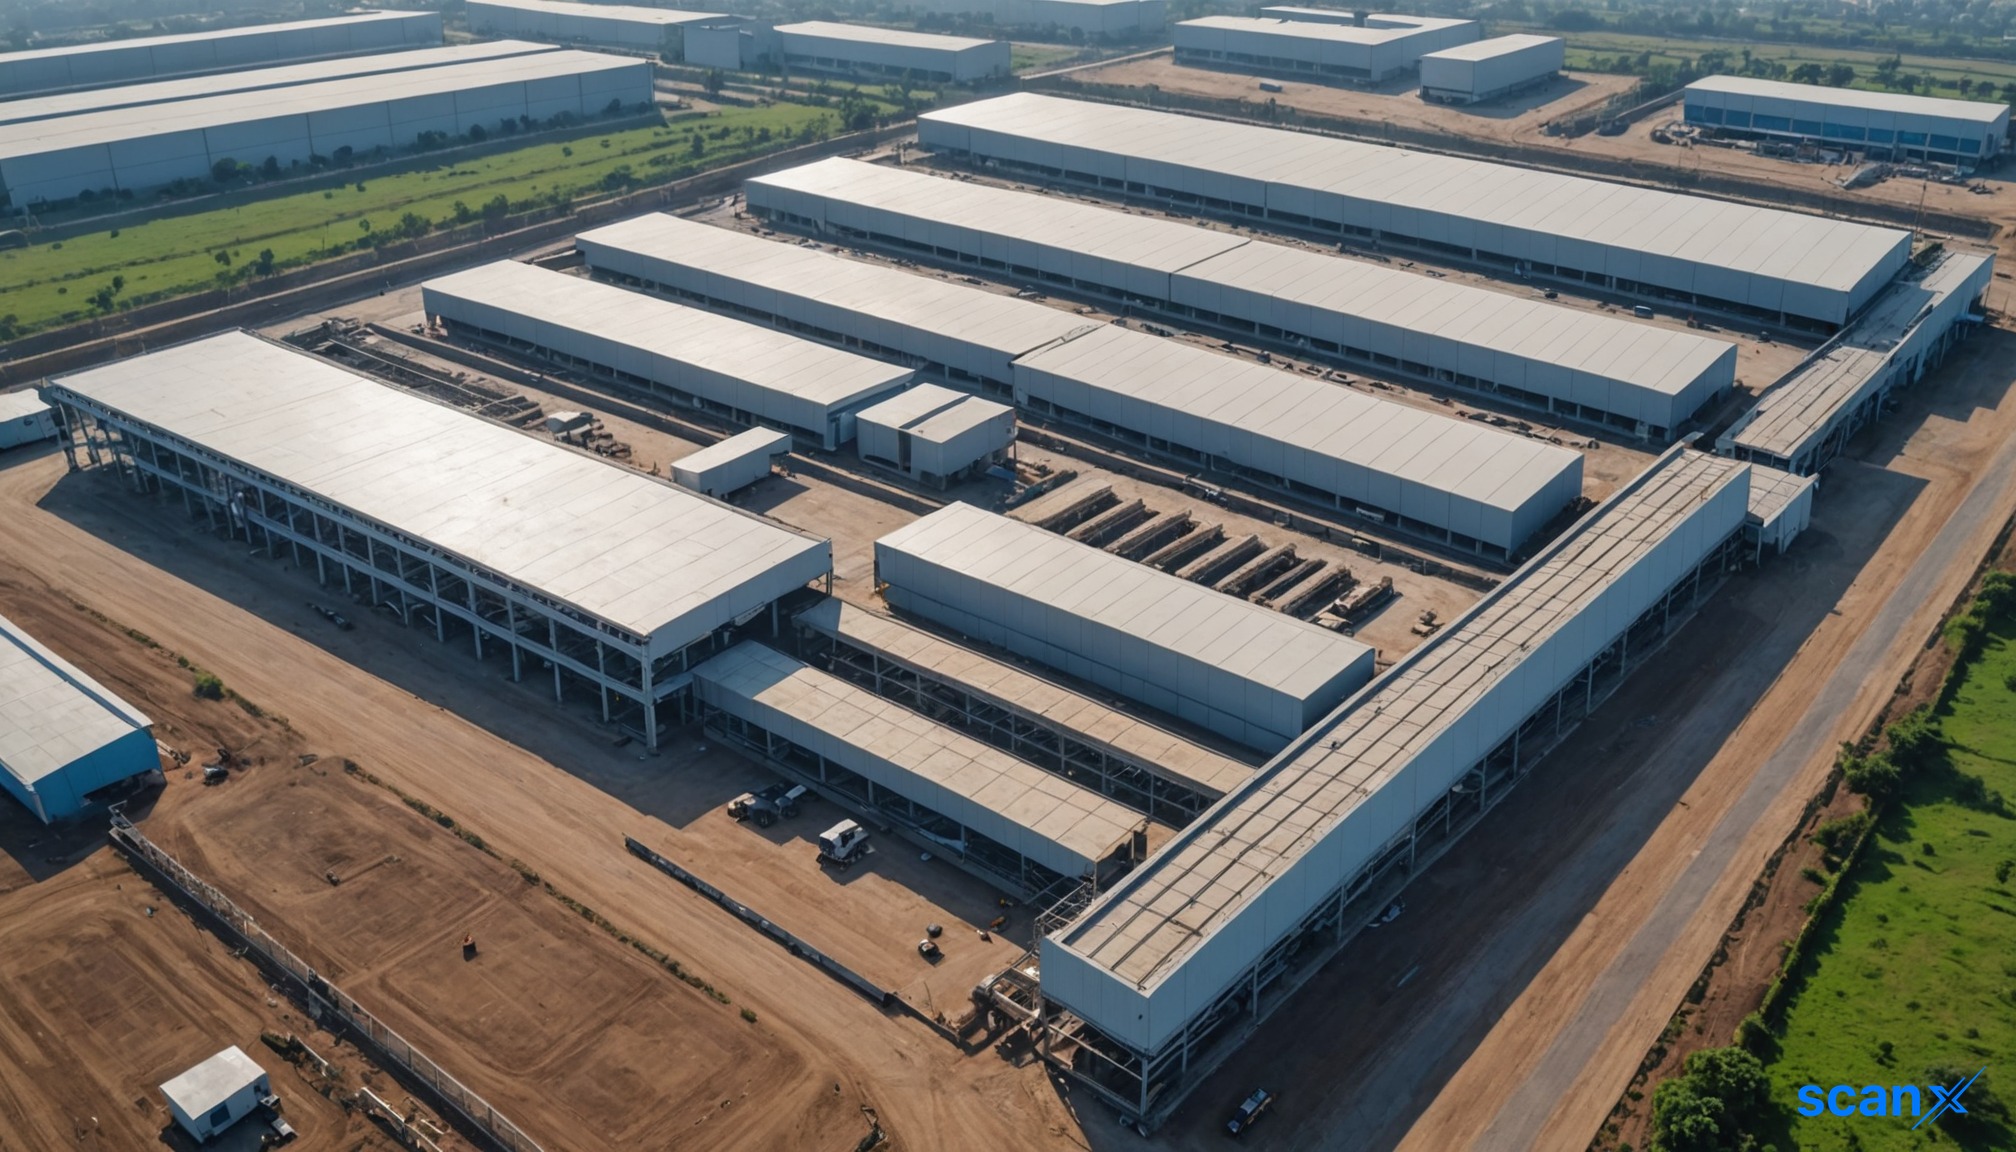
*this image is generated using AI for illustrative purposes only.
Shalimar Wires Industries reported a net profit of ₹219.75 lacs for the quarter ended June 30, 2026, marking a 117% year-on-year increase from ₹101.35 lacs in Q1FY25. The company’s revenue from operations grew 14% to ₹3,739.46 lacs, driven primarily by a rise in product sales to ₹3,738.92 lacs from ₹3,281.34 lacs in the prior year period. This performance underscores improved operational efficiency and top-line growth in the wires industry segment.
The Board of Directors approved the unaudited standalone financial results at a meeting held on August 11, 2026, in compliance with Regulation 33 of the SEBI (Listing Obligations and Disclosure Requirements) Regulations, 2015. The results were reviewed by the statutory auditors, Khandelwal Ray & Co., who issued a limited review report confirming that the statements are free of material misstatement. The meeting commenced at 12:30 PM and concluded at 1:21 PM.
Financial Performance Highlights
| Metric | Q1FY26 (₹ in lacs) | Q1FY25 (₹ in lacs) | Change |
|---|---|---|---|
| Revenue from Operations | 3,739.46 | 3,283.97 | +13.9% |
| Product Sales | 3,738.92 | 3,281.34 | +13.9% |
| Other Income | 43.88 | 52.08 | -15.7% |
| Total Expenses | 3,563.59 | 3,234.70 | +10.2% |
| Net Profit | 219.75 | 101.35 | +117.0% |
| EPS (Basic & Diluted) | ₹0.51 | ₹0.24 | +112.5% |
Revenue from operations increased to ₹3,739.46 lacs from ₹3,283.97 lacs in the corresponding quarter of the previous year. Other income declined slightly to ₹43.88 lacs from ₹52.08 lacs. Total expenses rose to ₹3,563.59 lacs from ₹3,234.70 lacs, with cost of materials consumed increasing significantly to ₹1,319.24 lacs from ₹971.51 lacs. However, changes in inventories provided a credit of ₹375.64 lacs, compared to ₹60.81 lacs in Q1FY25, aiding margin expansion.
What the Numbers Show
The disproportionate rise in net profit relative to revenue growth indicates significant operating leverage. While revenue grew by approximately 14%, net profit more than doubled. This divergence was largely aided by inventory adjustments; the change in inventories of finished goods and work-in-progress contributed a credit of ₹375.64 lacs in Q1FY26, up sharply from ₹60.81 lacs in Q1FY25. Additionally, finance costs increased to ₹384.00 lacs from ₹339.00 lacs, reflecting higher borrowing costs or increased debt levels, yet the bottom line remained robust due to the inventory benefit and controlled employee benefit expenses at ₹766.22 lacs.
Balance Sheet and Shareholding
Promoter and promoter group shareholding stood at 2,80,93,308 shares, representing 64.45% of the total share capital. Of these, 1,26,50,481 shares (45.03% of promoter holding) were pledged/encumbered. Public shareholding remained unchanged at 34.36%. The company’s paid-up equity share capital remained constant at ₹855.10 lacs.
Contingent Liabilities and Notes
No provision has been made for contingent liabilities, which include claims against the company not acknowledged as debts amounting to ₹77.28 lacs, demands of the Income Tax Authority under appeals of ₹524.27 lacs, and demands of various government authorities (Sales Tax, GST, Excise) under appeals totaling ₹811.20 lacs. Deferred tax assets/liabilities have not been considered in the accounts. Actuarial valuations under Ind AS 19 and fair valuation gains/losses on investments will be considered during the finalization of audited accounts for the year ended March 31, 2027.
Historical Stock Returns for Shalimar Wires Industries
| 1 Day | 5 Days | 1 Month | 6 Months | 1 Year | 5 Years |
|---|---|---|---|---|---|
| +0.72% | -2.24% | +12.53% | +15.45% | +8.28% | +186.58% |

To what extent is the 117% profit growth sustainable given that it was significantly driven by a one-time inventory credit rather than core operational margin expansion?
How will the high level of pledged promoter shares (45% of holding) impact the company's ability to raise fresh capital or manage debt refinancing in a rising interest rate environment?
What is the management's strategy to resolve the substantial contingent liabilities, particularly the ₹524.27 lacs in Income Tax appeals and ₹811.20 lacs in other government authority demands?
 19
19







 Access 50+ Readymade Screeners
  Use 200+ Custom Filters
  Get Full Market Insights





