

Polycon Q2FY27 Results: Net loss narrows 12% YoY to ₹89 crore


- Net loss narrowed 12% YoY to ₹89.10 crore in Q2FY27
- Revenue from operations fell 28% YoY to ₹277.25 crore
- Other income surged to ₹9.16 crore from ₹0.05 crore YoY
- Half-year net loss widened to ₹136.17 crore vs ₹127.04 crore in H1FY26



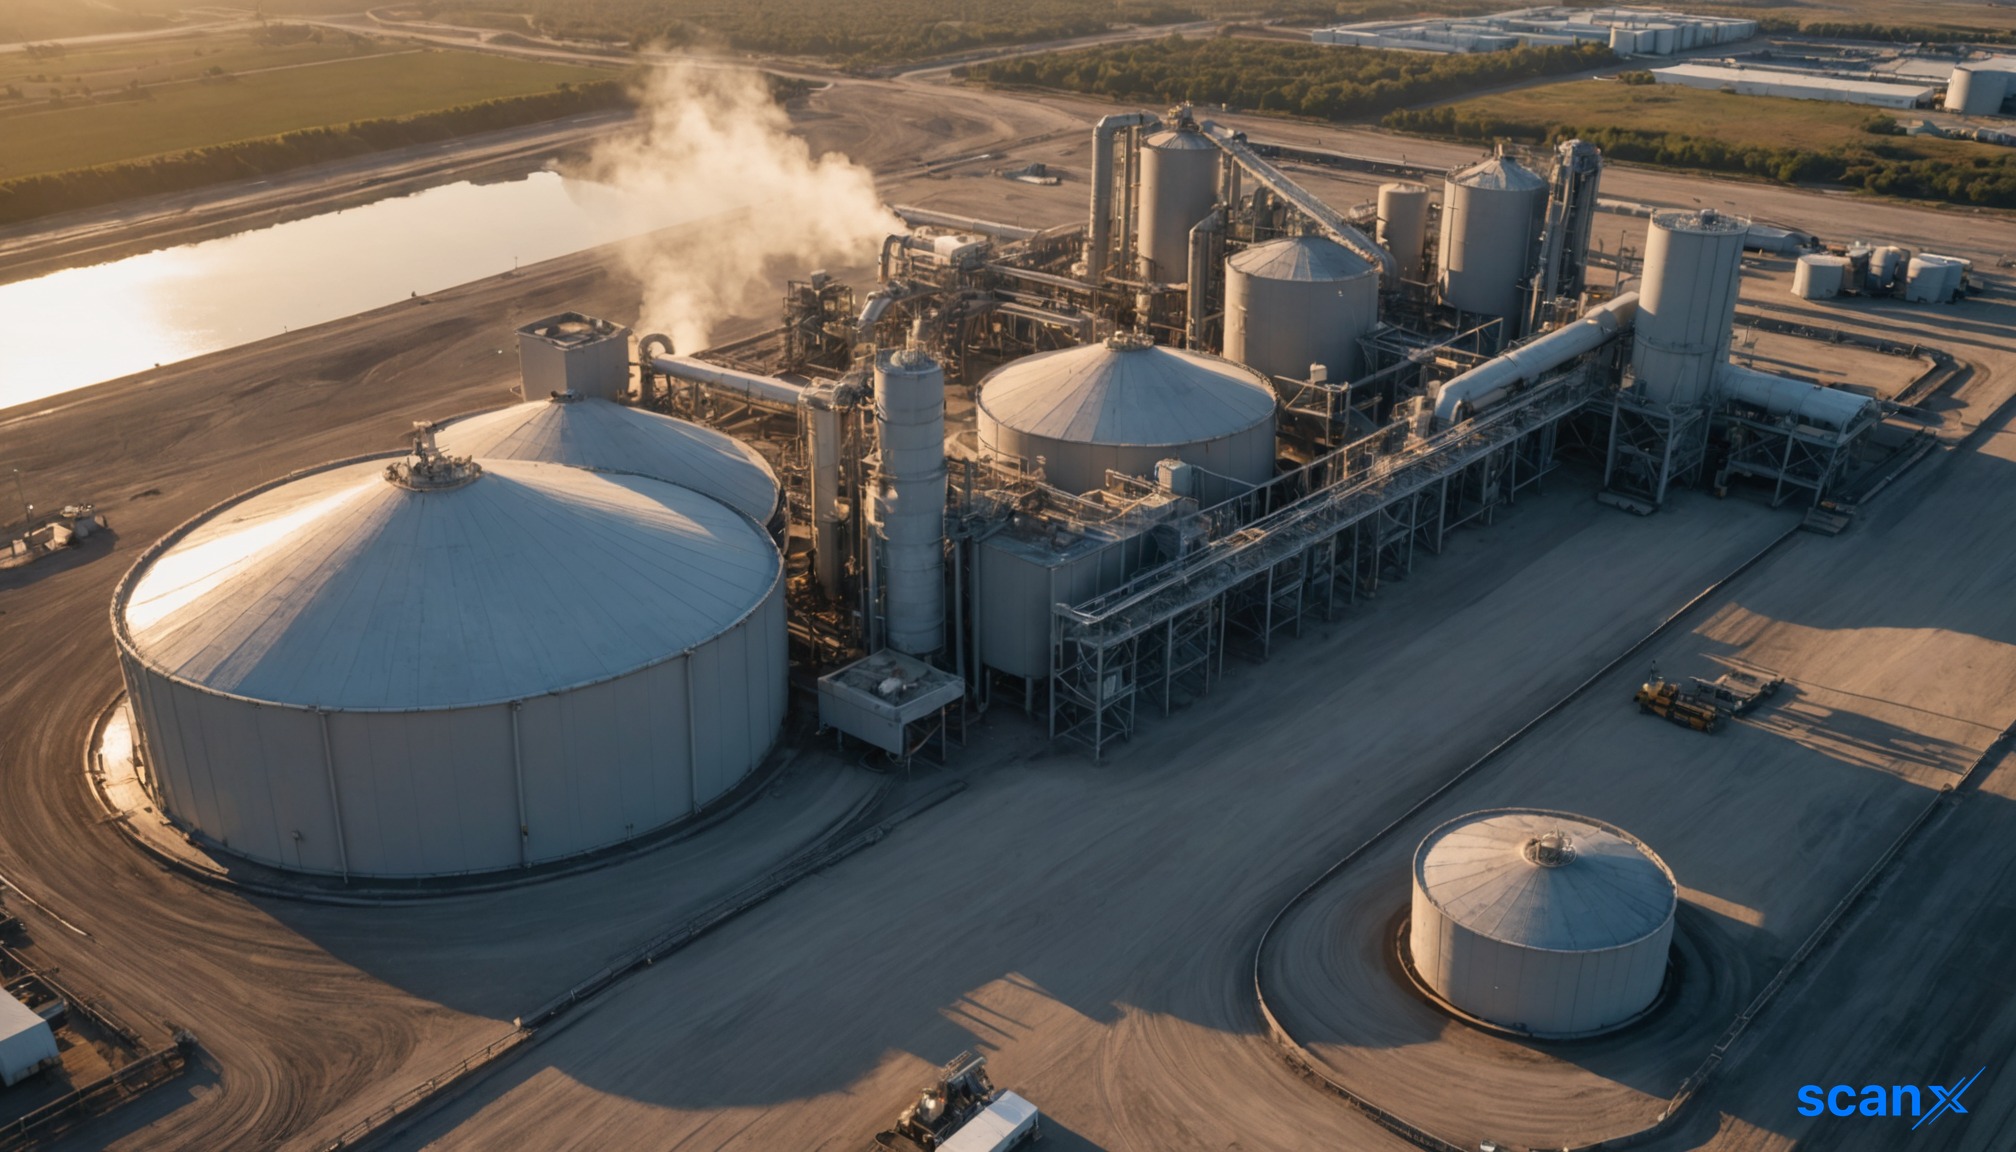
*this image is generated using AI for illustrative purposes only.
Polycon International reported a standalone net loss of ₹89.10 crore for the quarter ended September 30, 2026, narrowing from ₹101.52 crore in the corresponding period last year.
The Jaipur-based infrastructure company saw revenue from operations contract by 28% year-on-year to ₹277.25 crore, down from ₹385.77 crore in Q2FY26. Despite the top-line decline, the company managed to reduce its net loss due to lower costs and improved other income contributions.
Financial Performance Overview
For the half-year ended September 30, 2026 (H1FY27), Polycon posted a net loss of ₹136.17 crore, compared to a loss of ₹127.04 crore in H1FY26. Total revenue for the half-year stood at ₹722.19 crore, reflecting a decline from ₹821.62 crore in the previous year's comparable period.
| Metric | Q2FY27 | Q2FY26 | Change | H1FY27 | H1FY26 |
|---|---|---|---|---|---|
| Revenue from operations | ₹277.25 crore | ₹385.77 crore | -28.1% | ₹701.89 crore | ₹821.39 crore |
| Total Income | ₹286.41 crore | ₹385.82 crore | -25.8% | ₹722.19 crore | ₹821.62 crore |
| Profit/(Loss) before tax | -₹92.95 crore | -₹104.36 crore | +11.0% | -₹142.68 crore | -₹132.75 crore |
| Net Profit/(Loss) | -₹89.10 crore | -₹101.52 crore | +12.2% | -₹136.17 crore | -₹127.04 crore |
| EPS (Basic) | -₹1.82 | -₹2.08 | N/A | -₹2.78 | -₹2.60 |
Cost Structure and Margins
Total expenses for Q2FY27 decreased to ₹379.36 crore from ₹490.18 crore in Q2FY26. A significant contributor to this reduction was the cost of materials consumed, which fell to ₹142.42 crore from ₹232.97 crore year-on-year. Employee benefits expense rose slightly to ₹54.52 crore from ₹51.96 crore, while finance costs remained relatively stable at ₹56.42 crore compared to ₹52.87 crore in the prior year.
Other income played a notable role in cushioning the bottom line, surging to ₹9.16 crore in Q2FY27 against a negligible ₹0.05 crore in Q2FY26. This shift helped offset some of the operational losses, although the company remained in the red.
What the Numbers Show
A divergence between revenue contraction and loss narrowing highlights the impact of non-operating items and cost management. While revenue fell sharply by 28%, the net loss only narrowed by 12%. This suggests that the improvement in profitability was driven less by operational efficiency and more by the substantial increase in other income (from ₹0.05 crore to ₹9.16 crore) and a significant drop in material costs relative to the revenue decline. The persistent negative EBITDA indicates that core operations remain under pressure despite these adjustments.
Historical Stock Returns for Polycon International
| 1 Day | 5 Days | 1 Month | 6 Months | 1 Year | 5 Years |
|---|---|---|---|---|---|
| +4.83% | 0.0% | +22.09% | +61.62% | +20.25% | +261.47% |

What specific non-operating assets or one-time gains drove the surge in other income to ₹9.16 crore, and is this revenue stream sustainable for future quarters?
How does the 28% revenue contraction correlate with Polycon's current order book backlog, and are there signs of new project wins to stabilize top-line growth?
Given the persistent negative EBITDA, what strategic cost-cutting measures or operational restructuring plans has management outlined to restore core profitability?
 20
20










 Create Custom Screeners
  Access 200+ Pre-built Filters
  Use 50+ Readymade Screener





