

Mapro Industries reports net loss in Q4FY26


Mapro Industries Limited reported a net loss of ₹17.869 lakh for Q4FY26 on total income of ₹75.700 lakh. For the full year FY26, the company posted a net profit of ₹30.691 lakh with total income rising to ₹158.720 lakh. The Board approved the audited financial results on May 22, 2016.


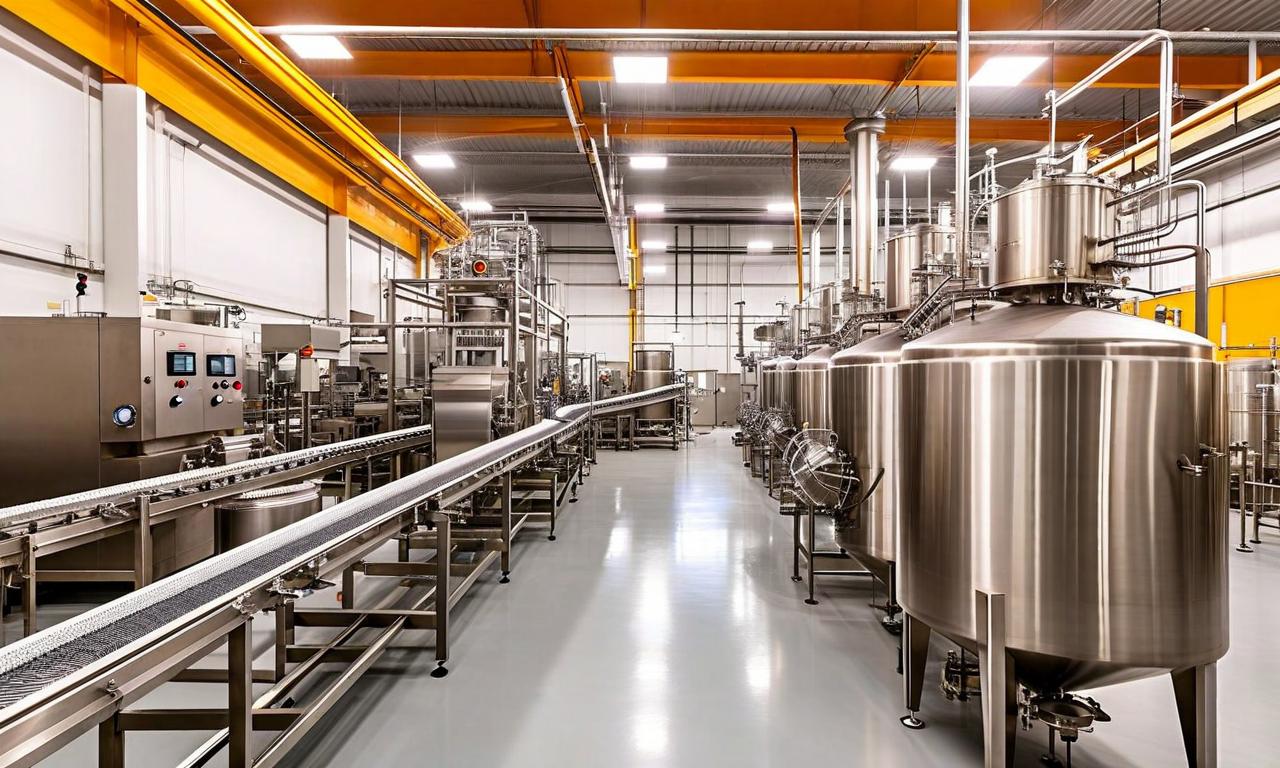
*this image is generated using AI for illustrative purposes only.
Mapro Industries Limited reported a net loss of ₹17.869 lakh for the quarter ended March 31, 2026, as total income from operations increased to ₹75.700 lakh. The company had posted a net profit of ₹27.910 lakh in the quarter ended December 31, 2025, with total income of ₹40.500 lakh. For the corresponding quarter in the previous year, the company reported a net loss of ₹17.360 lakh on total income of ₹17.720 lakh.
For the financial year ended March 31, 2026, Mapro Industries recorded a net profit of ₹30.691 lakh, a slight increase from the ₹26.910 lakh profit reported in the previous year. Total income from operations for the year stood at ₹158.720 lakh, compared to ₹93.180 lakh in FY25. The company's equity share capital remained constant at ₹838.890 lakh during the period.
The basic and diluted earnings per share (EPS) for the quarter ended March 31, 2026, stood at -₹0.021. For the full year, the basic and diluted EPS were reported at ₹0.037, compared to ₹0.032 in the previous year. The reserves, excluding revaluation reserve, were reported at ₹1,793.300 lakh for the year ended March 31, 2026, up from ₹1,762.610 lakh in the prior year.
The financial results were reviewed by the Audit Committee and approved by the Board of Directors at their meeting held on May 22, 2016. The Statutory Auditors have performed an audit of the financial results for the quarter and year ended March 31, 2016, and stated there were no qualifications in the audit report.
Financial Performance Summary
| Particulars | Quarter Ended March 31, 2016 (Audited) | Quarter Ended Dec 31, 2015 (Unaudited) | Year Ended March 31, 2016 (Audited) |
|---|---|---|---|
| Total income from operations (net) | ₹75.700 lakh | ₹40.500 lakh | ₹158.720 lakh |
| Net Profit / (Loss) for the period | (₹17.869 lakh) | ₹27.910 lakh | ₹30.691 lakh |
| Equity Share Capital | ₹838.890 lakh | ₹838.890 lakh | ₹838.890 lakh |
| Reserves (excluding Revaluation Reserve) | ₹0.000 lakh | ₹0.000 lakh | ₹1,793.300 lakh |
| Basic Earnings Per Share (₹10 each) | -₹0.021 | ₹0.033 | ₹0.037 |
Historical Stock Returns for Mapro Industries
| 1 Day | 5 Days | 1 Month | 6 Months | 1 Year | 5 Years |
|---|---|---|---|---|---|
| +1.99% | +12.56% | +64.88% | +60.61% | 0.0% | +32.22% |

What factors contributed to the sharp decline in profitability during the March 2016 quarter despite the increase in operational income?
How does Mapro Industries plan to sustain the year-over-year growth in total income from operations in the upcoming fiscal year?
What strategic initiatives will the company undertake to improve the basic EPS given the marginal increase from the previous year?
 20
20






 Access 50+ Readymade Screeners
  Use 200+ Custom Filters
  Get Full Market Insights





