

Paushak Q2 EBITDA margin expands to 29.51% on 78% profit jump


- Net profit rose 57% YoY to ₹1,351 lakh in Q2FY27
- Revenue from operations increased 52% YoY to ₹8,932 lakh
- EBITDA expanded 78% YoY to ₹264 lakh, lifting margin to 29.51%
- Trade receivables climbed 40.7% since March 31, 2026

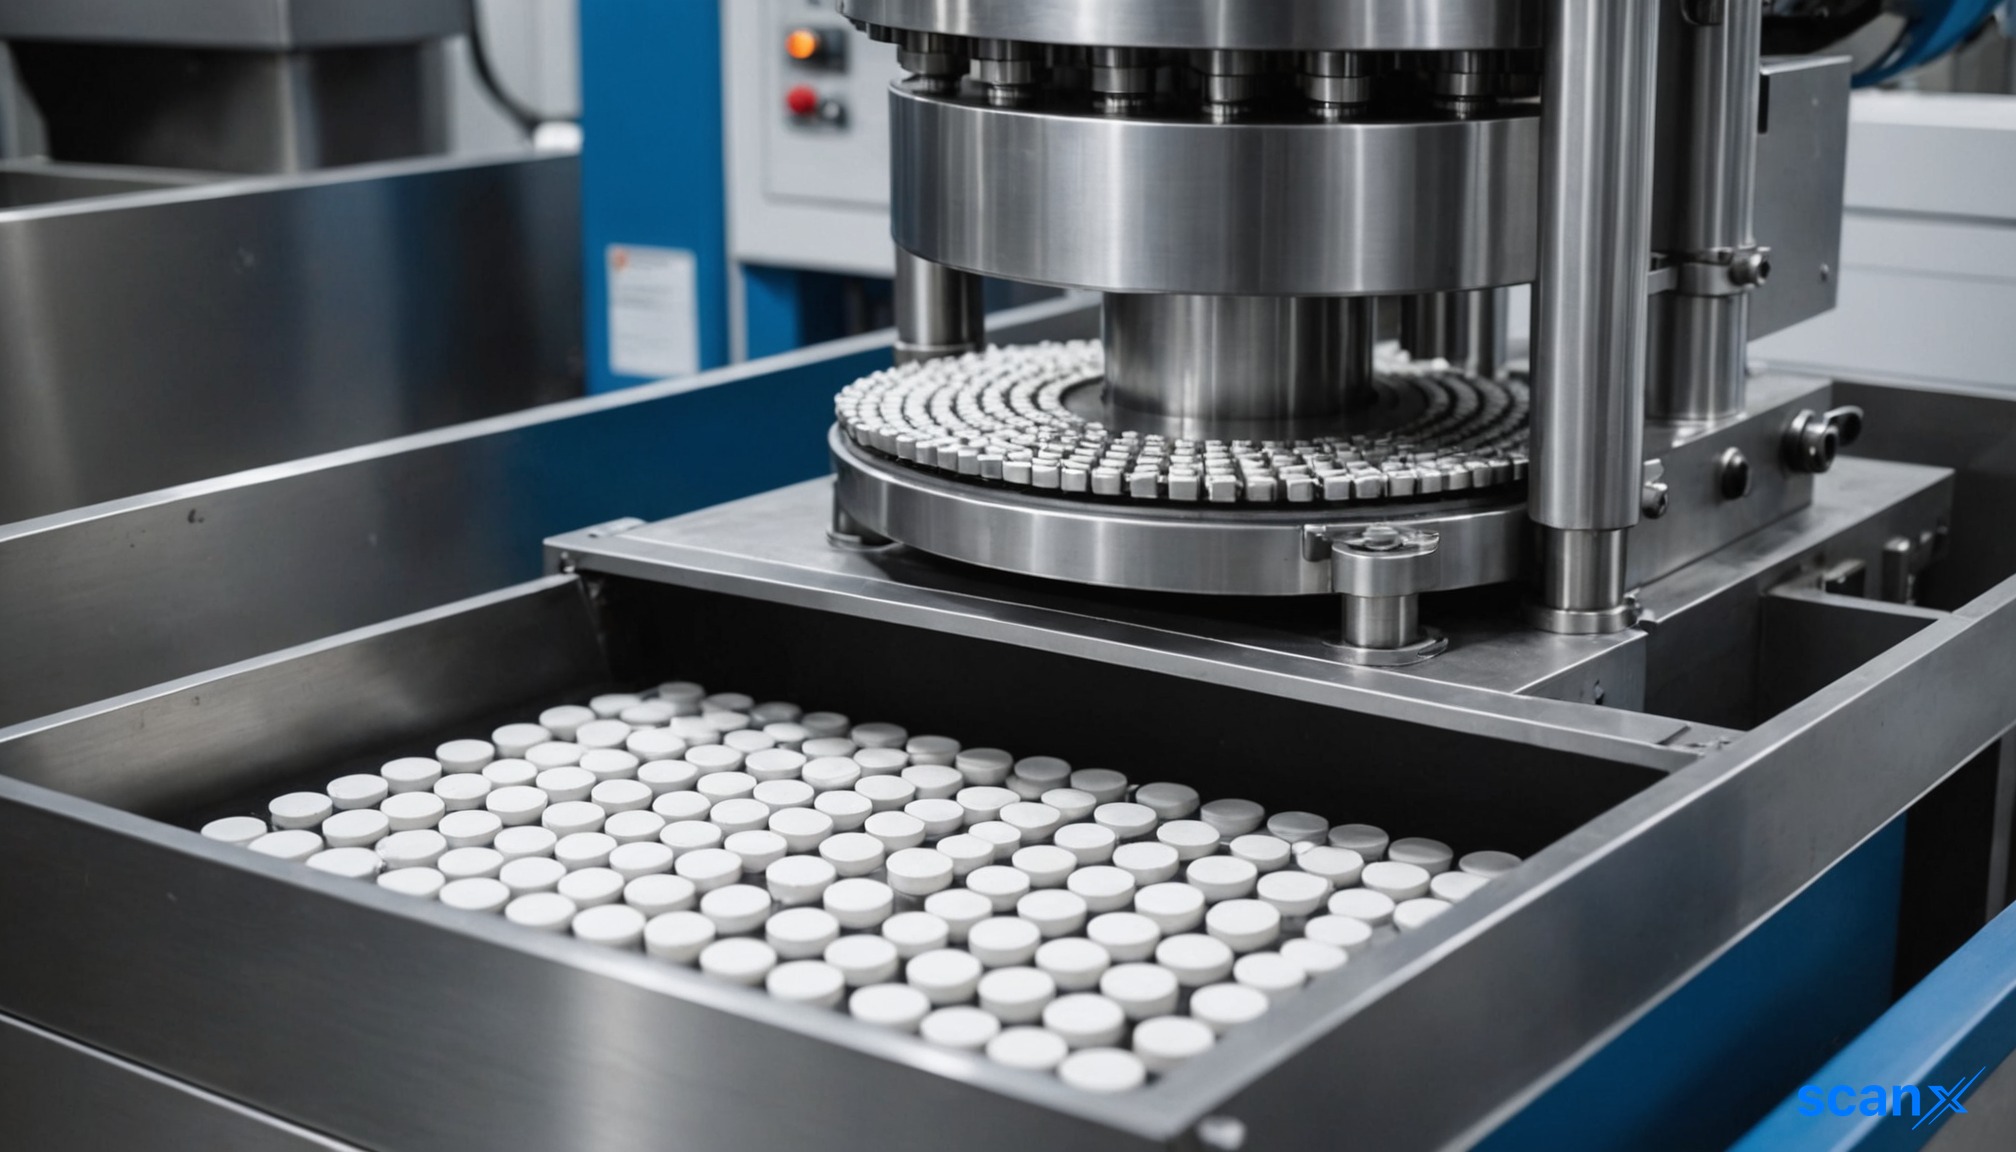

*this image is generated using AI for illustrative purposes only.
Paushak Limited reported a 57% year-on-year increase in net profit for the quarter ended September 30, 2026 (Q2FY27), reaching ₹1,351 lakh compared to ₹861 lakh in the corresponding period last year. The speciality chemicals manufacturer also witnessed robust top-line growth, with revenue from operations rising 52% YoY to ₹8,932 lakh.
The company’s Board of Directors approved these unaudited financial results during a meeting held on October 16, 2026. The results were reviewed by statutory auditors CNK & Associates LLP and recommended by the Audit Committee prior to board approval.
Quarterly Financial Performance
The following table highlights the key financial metrics for Q2FY27 against the previous quarter and the same quarter in the previous fiscal year:
| Metric | Q2FY27 | Q1FY27 | Q2FY26 | Change (YoY) |
|---|---|---|---|---|
| Revenue from Operations | ₹8,932 lakh | ₹8,355 lakh | ₹5,878 lakh | +52.0% |
| Total Income | ₹9,135 lakh | ₹8,669 lakh | ₹5,982 lakh | +52.7% |
| EBITDA | ₹264 lakh | Not disclosed | ₹148 lakh | +78.4% |
| EBITDA Margin | 29.51% | Not disclosed | 25.18% | +433 bps |
| Profit Before Tax | ₹1,860 lakh | ₹1,902 lakh | ₹1,134 lakh | +64.0% |
| Net Profit (PAT) | ₹1,351 lakh | ₹1,510 lakh | ₹861 lakh | +56.9% |
| EPS (Basic & Diluted) | ₹5.48 | ₹6.13 | ₹3.49 | +57.0% |
Note: Figures are in lakhs. Previous period EPS has been restated to reflect share sub-division and bonus allotment.
What the Numbers Show
A significant divergence is visible between the quarter-on-quarter trends of revenue and profitability. While revenue from operations grew 6.9% QoQ (from ₹8,355 lakh to ₹8,932 lakh), the net profit declined 10.5% QoQ (from ₹1,510 lakh to ₹1,351 lakh). This suggests margin compression in the second quarter despite higher sales volumes. Specifically, the effective tax rate appears to have impacted the bottom line, as current tax expenses rose to ₹274 lakh in Q2FY27 from ₹249 lakh in Q1FY27, while deferred tax liabilities also increased.
However, on a year-on-year basis, operational efficiency improved markedly. EBITDA surged 78.4% to ₹264 lakh from ₹148 lakh in Q2FY26, expanding the EBITDA margin by 433 basis points to 29.51% from 25.18%. This indicates that while tax burdens weighed on net profit sequentially, core operating profitability strengthened significantly compared to the previous year.
Additionally, the balance sheet indicates a substantial build-up in working capital. Trade receivables surged to ₹7,718 lakh as of September 30, 2026, up from ₹5,486 lakh as of March 31, 2026. This 40.7% increase in receivables outpaced the half-yearly revenue growth, potentially signaling extended collection cycles or aggressive sales terms to drive the observed top-line expansion.
Half-Year Performance
For the six months ended September 30, 2026 (H1FY27), Paushak recorded:
- Revenue from operations: ₹17,287 lakh (up 50.8% YoY from ₹11,466 lakh)
- Net Profit: ₹2,862 lakh (up 38.6% YoY from ₹2,065 lakh)
- EBITDA Margin: Improved due to operating leverage, with Q2 margin reaching 29.51%.
The company operates in a single reportable segment, Speciality Chemicals. The results have been prepared in accordance with Indian Accounting Standards (Ind AS) and reviewed under Regulation 33 of SEBI (LODR) Regulations, 2015.
Historical Stock Returns for Paushak
| 1 Day | 5 Days | 1 Month | 6 Months | 1 Year | 5 Years |
|---|---|---|---|---|---|
| +4.60% | +23.03% | +21.02% | +63.89% | +40.50% | +40.50% |

How will Paushak Limited address the 40.7% surge in trade receivables to mitigate potential liquidity risks in upcoming quarters?
What specific product lines or customer segments drove the 52% YoY revenue growth, and is this demand expected to sustain through FY27?
Can the company maintain its expanded EBITDA margin of 29.51% if raw material costs or input prices rise in the second half of the fiscal year?
 19
19












 Access 50+ Readymade Screeners
  Use 200+ Custom Filters
  Get Full Market Insights





