

Mangalam Worldwide Q2 EBITDA margin expands to 10.90% on revenue growth


- Net profit rose 31.3% YoY to ₹1,382.94 lakh in Q2FY27
- Revenue from operations increased 13.65% to ₹36,039.97 lakh
- EBITDA margin expanded to 10.90% from 6.57% YoY
- Finance costs surged to ₹1,788.66 lakh due to higher borrowings



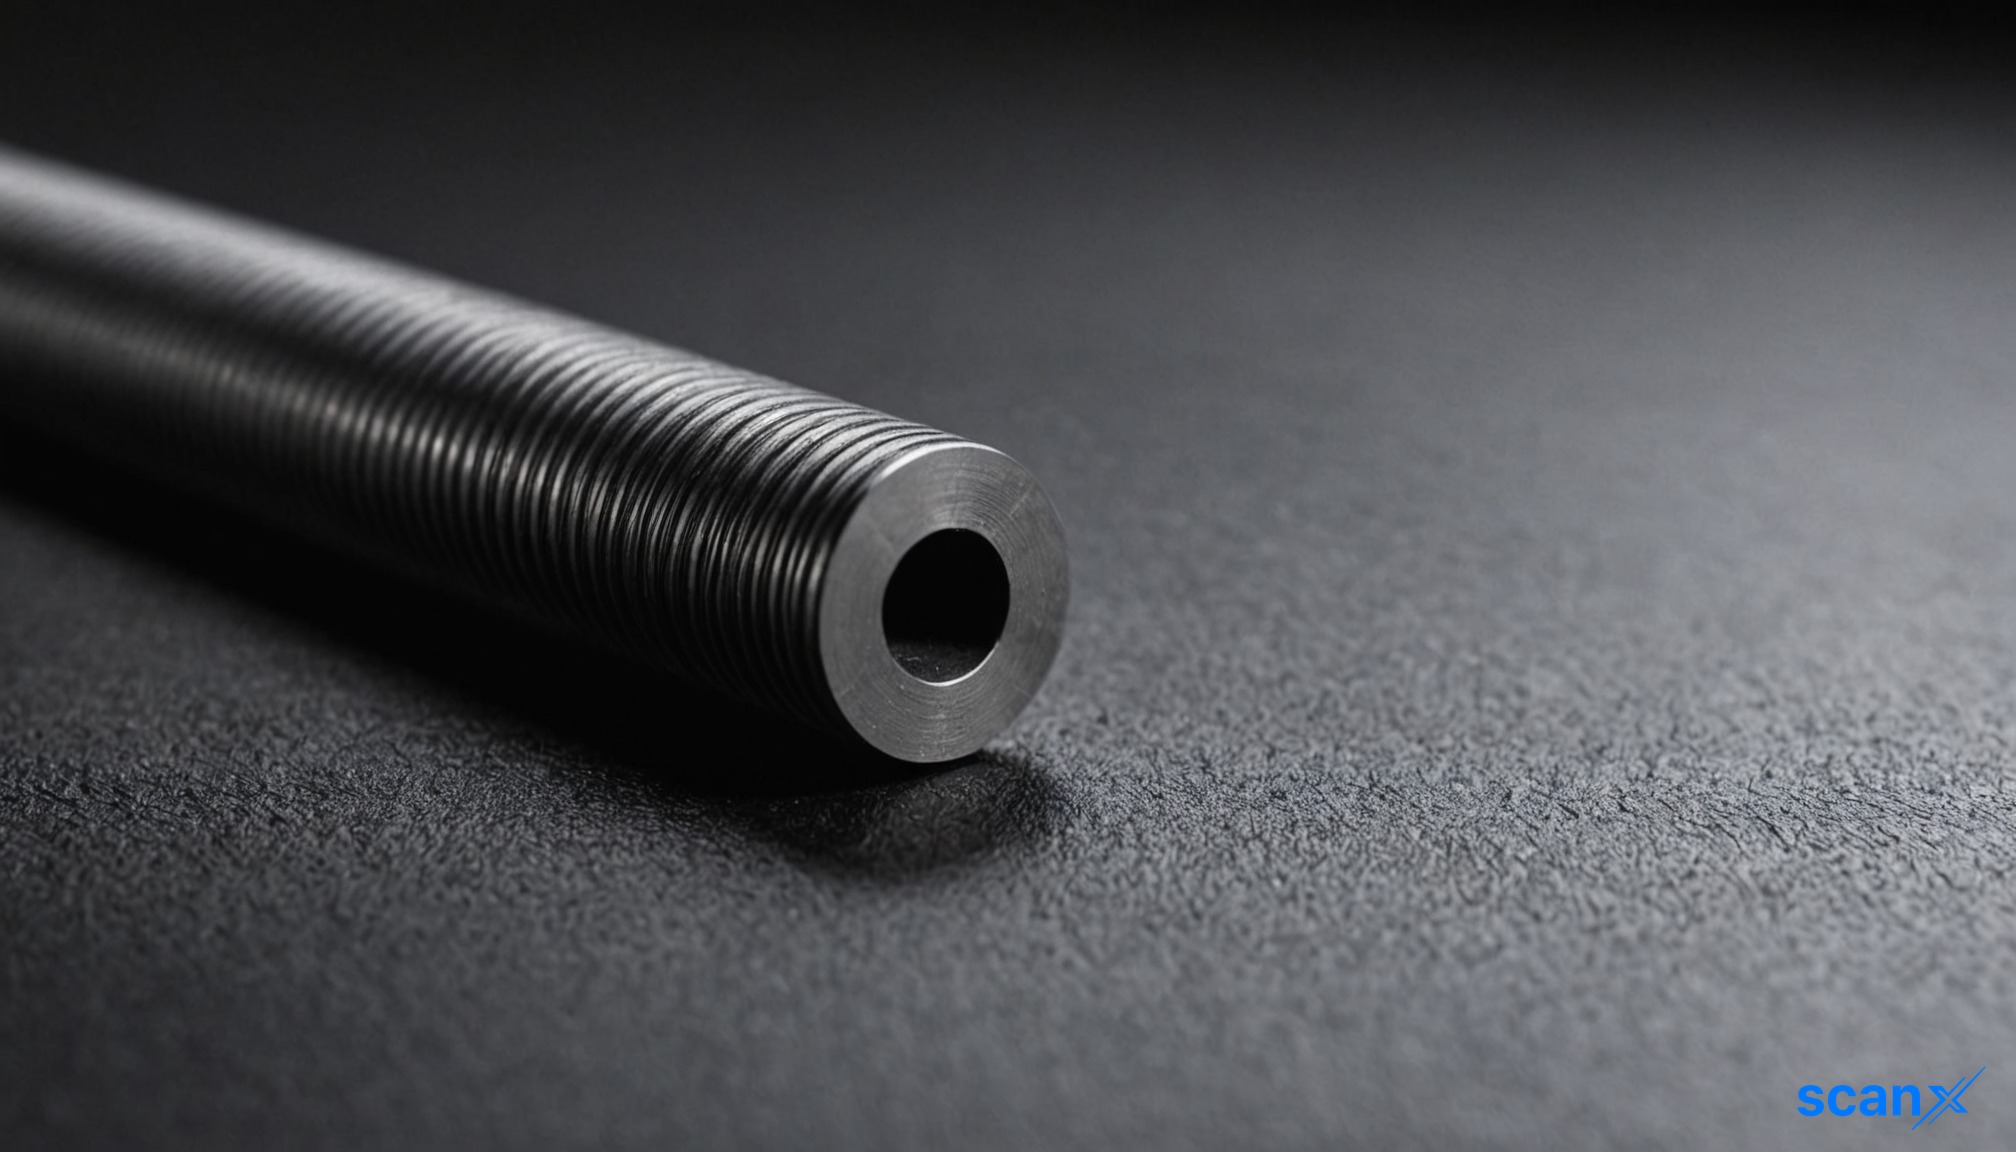
*this image is generated using AI for illustrative purposes only.
Mangalam Worldwide reported a 31.3% year-on-year increase in standalone net profit for the second quarter of fiscal year 2027 (Q2FY27). The Ahmedabad-based stainless steel manufacturer clocked a net profit of ₹1,382.94 lakh, up from ₹1,052.99 lakh in the corresponding period last year.
Revenue from operations grew 13.65% YoY to ₹36,039.97 lakh, compared to ₹31,711.03 lakh in Q2FY26. The company operates as a single segment engaged in manufacturing stainless steel billets, ingots, bars, and pipes, along with trading steel scrap and ferro alloys.
Financial Performance Highlights
The quarter saw robust top-line growth supported by improved operating margins. EBITDA excluding other income stood at 10.16% of revenue, an expansion from the previous quarter's 8.63%. Below is a snapshot of the key standalone financial metrics:
| Metric | Q2FY27 (Sep '26) | Q2FY26 (Sep '25) | Change |
|---|---|---|---|
| Revenue from Operations | ₹36,039.97 lakh | ₹31,711.03 lakh | +13.65% |
| Total Income | ₹36,105.66 lakh | ₹31,851.92 lakh | +13.35% |
| Profit Before Tax | ₹1,770.00 lakh | ₹1,031.52 lakh | +71.6% |
| Net Profit After Tax | ₹1,382.94 lakh | ₹1,052.99 lakh | +31.3% |
| EPS (Basic) | ₹0.47 | ₹0.36 | +30.6% |
Note: EPS figures are adjusted for the equity share split effective July 10, 2026.
What the Numbers Show
A significant divergence exists between the sharp rise in pre-tax profits and the modest growth in net profit. While Profit Before Tax surged 71.6% YoY, net profit grew only 31.3%. This gap is primarily attributed to the tax expense, which shifted from a credit of ₹21.47 lakh in Q2FY26 to a charge of ₹387.06 lakh in Q2FY27. In the previous corresponding quarter, the company benefited from a deferred tax credit and negligible current tax, whereas the current period reflects a normalized tax burden alongside deferred tax charges.
Additionally, finance costs rose significantly to ₹1,788.66 lakh from ₹927.20 lakh YoY, reflecting increased borrowing to fund working capital and capital expenditure. Despite this higher interest burden, operating margins expanded, indicating strong core business performance.
Balance Sheet and Cash Flow Dynamics
The company's balance sheet expanded considerably during the half-year period. Total assets grew to ₹1,21,166.73 lakh as on September 30, 2026, from ₹91,797.21 lakh on March 31, 2026. This expansion was driven by a substantial increase in inventories, which rose to ₹59,374.42 lakh, and trade receivables, which climbed to ₹24,568.97 lakh.
However, this working capital build-up resulted in negative cash flow from operations. Net cash used in operating activities stood at (₹4,721.96) lakh for H1FY27, compared to a positive ₹2,962.55 lakh in H1FY26. The outflow was primarily due to increases in trade receivables (₹8,424.07 lakh) and inventories (₹13,461.24 lakh), partially offset by an increase in trade payables.
To support this working capital requirement and capex, the company raised significant funds through debt. Proceeds from long-term borrowings amounted to ₹8,282.56 lakh during the half-year, while short-term borrowings also saw a net inflow of ₹3,582.61 lakh. Consequently, long-term borrowings on the balance sheet more than doubled to ₹16,607.60 lakh from ₹9,223.01 lakh at the start of the fiscal year.
Corporate Developments
The Board approved the allotment of non-convertible debentures (NCDs) aggregating to ₹100 crore in two tranches, rated 'ACUITE A+' with a Stable Outlook. The proceeds have been fully utilized for stated objects.
Separately, the National Stock Exchange (NSE) returned applications for two corporate actions: the scheme of amalgamation of subsidiary Mangalam Saarloh Private Limited with the Company, and the preferential issue of convertible warrants. Both matters remain pending regulatory clarity or re-filing.
Historical Stock Returns for Mangalam Worldwide
| 1 Day | 5 Days | 1 Month | 6 Months | 1 Year | 5 Years |
|---|---|---|---|---|---|
| -2.52% | -3.50% | -0.07% | +51.32% | +80.71% | +295.42% |

How will the significant increase in inventory and receivables impact Mangalam Worldwide's operating cash flow conversion in the second half of FY27?
What is the projected trajectory for finance costs as the company continues to service the newly doubled long-term debt and ₹100 crore NCD issuance?
Will the normalization of tax expenses, following the previous year's deferred tax credit, constrain net profit growth despite expanding EBITDA margins?
 20
20









 Create Custom Screeners
  Access 200+ Pre-built Filters
  Use 50+ Readymade Screener





