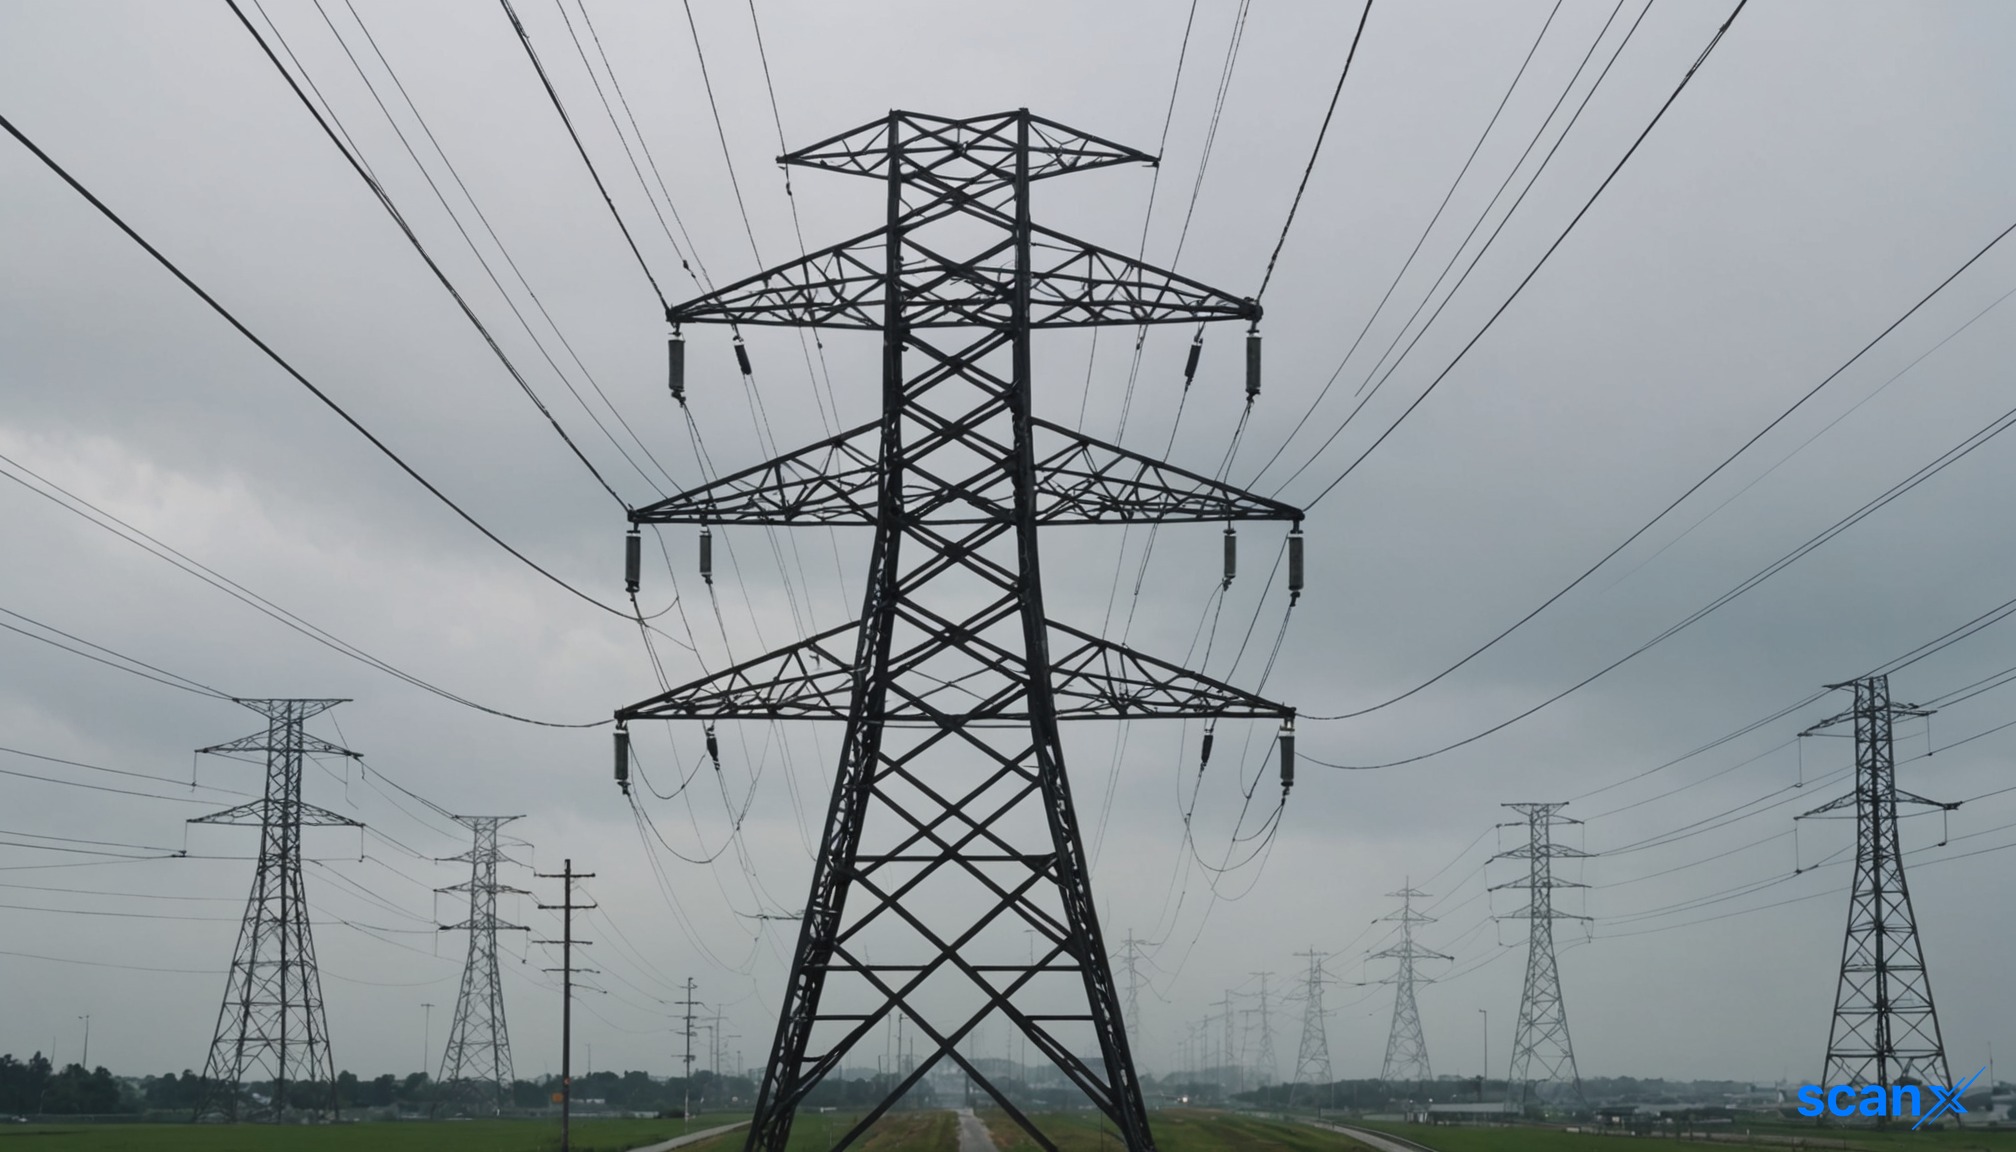
Kec International has received a confirmed work order valued at ₹1,300 crore from multiple clients across India, the Middle East, and the Americas. The contract encompasses transmission and distribution projects, including a 400 kV transmission line in Northern India, 380 kV lines in Saudi Arabia, and the supply of towers, hardware, and poles in the Americas. It also includes various orders for cables and conductors in domestic and overseas markets. This is a Type A confirmed order, meaning the value is firm and executable upon issuance of the letter of award.
ORDER IN FINANCIAL CONTEXT
The ₹1,300 crore order represents approximately 22% of the company's average quarterly revenue of ₹5,891.28 crore. The total disclosed order book sums to ₹10,361.00 crore across 8 orders (sum of the 8 orders disclosed across the last 3 fiscal quarters shown in the table below). This backlog provides coverage of 1.76 quarters of average quarterly revenue, implying roughly six months of revenue visibility at current execution rates. The book-to-bill ratio, calculated as total disclosed order book divided by trailing twelve-month revenue of ₹23,565.1 crore, indicates a moderate pipeline relative to annual sales scale.
COMPANY ORDER TRACK RECORD
Order inflow velocity has decelerated sequentially from the significant surge seen in the first quarter of the fiscal year. In Q1FY27, the company recorded ₹8,118.00 crore in inflows, driven by multiple mega contracts. This slowed to ₹2,243.00 crore in Q2FY27. The current order value of ₹1,300 crore is consistent with the company's typical per-order size, which has ranged between ₹1,002.0 crore and ₹1,754.0 crore in recent filings.
| Quarter |
Total Order Inflow (₹ Cr) |
Key Awarding Entities |
| Q2FY27 (Jul-Sep 2026) |
2,243.00 |
Various clients across India, Middle East, and Americas; Various clients including renowned real estate developer, private developer in Western India, and international clients in Africa and Americas |
| Q1FY27 (Apr-Jun 2026) |
8,118.00 |
Multiple clients (private developer in Southern India, automobile manufacturer in Northern India, private developer in Western India); Multiple clients including private developers in Southern India and Western India, automobile manufacturers in Northern India, and overseas clients in the Americas; Multiple entities including private developers in Western India, steel producer in Eastern India, and private developer in Southern India; Not specified |
EXECUTION AND REVENUE QUALITY
Revenue growth has been steady, but operating margins showed a slight contraction in the most recent quarter. Operating profit margin (OPM) declined to 5.79% in Q1FY27 from 7.01% in Q4FY26 and 6.19% in Q3FY26. Net profit also fell to ₹72.60 crore in Q1FY27 compared to ₹192.80 crore in the preceding quarter. This margin compression warrants monitoring as new contracts execute, particularly given the mix of civil and EPC works involved.
| Quarter |
Revenue (₹ Cr) |
Net Profit (₹ Cr) |
OPM (%) |
| Q1FY27 |
5,037.50 |
72.60 |
5.79% |
| Q4FY26 |
6,419.80 |
192.80 |
7.01% |
| Q3FY26 |
6,011.60 |
127.50 |
6.19% |
REVENUE GROWTH - ORDER WINS TRANSLATING TO REVENUE
As Kec International has sustained order wins, with inflows accelerating significantly in Q1FY27, its annual revenue has grown from ₹13,755.70 crore in FY22 to ₹23,555.90 crore in FY26, representing a YoY growth of +7.5% based on the latest annual data. The consistent order pipeline has supported top-line expansion, although net profit growth has been more volatile, rising +6.1% in FY26 after a sharp +64.6% jump in FY25.
WORKING CAPITAL AND EXECUTION CAPACITY
The balance sheet shows a current ratio of 1.23x, indicating sufficient short-term liquidity to manage immediate obligations. However, Total Liabilities/Equity stands at 3.08x, reflecting elevated liabilities that include trade payables and other non-debt items. Operating cashflow turned negative in FY26 at -₹414.10 crore, down from ₹419.10 crore in FY25. This shift suggests that working capital requirements are absorbing cash generated from operations, a common dynamic in capital-intensive infrastructure projects during peak execution phases.
WHAT TO WATCH
- Execution rate: Monitor quarterly revenue run-rate against the ₹10,361.00 crore backlog to assess whether conversion accelerates or slows.
- OPM trajectory: Track margin quality on new T&D and cable orders versus the historical average of ~6.5%, especially after the dip to 5.79% in Q1FY27.
- Client concentration: Evaluate what percentage of the disclosed order book comes from top clients, noting the diversified mix across domestic and international entities.
- Cash conversion: Watch for improvement in operating cashflow as the negative trend from FY26 reverses, signaling better working capital management.
KEY OBSERVATIONS
- Valuation check (as of 14 Sep 2026): P/E of 19.9x against ROCE of 20.32%. At the time of this article, valuation was pricing in execution improvement not yet visible in return ratios. (P/E is price-derived and will change; ROCE is from audited financials)
- Leverage flag: Total Liabilities/Equity of 3.08x; balance sheet carries elevated liabilities, and ability to fund working capital for the existing backlog should be monitored.
- Cash conversion: Operating cashflow of -₹414.10 crore in FY26; backlog is not converting to cash efficiently, and receivables or working capital cycle may be stretched.





 17
17








 Access 50+ Readymade Screeners
  Use 200+ Custom Filters
  Get Full Market Insights





