

Jainex Aamcol Q2 Results: Net profit falls 8.5% QoQ to ₹47.87 lakh


Jainex Aamcol reported Q2FY26 net profit of ₹47.87 lakh, down 8.5% QoQ. Revenue rose 15.6% YoY to ₹753.02 lakh. Debt-equity ratio increased to 0.83 times as borrowings rose to ₹1,469.40 lakh. Gear cutting tools remain the primary revenue driver.


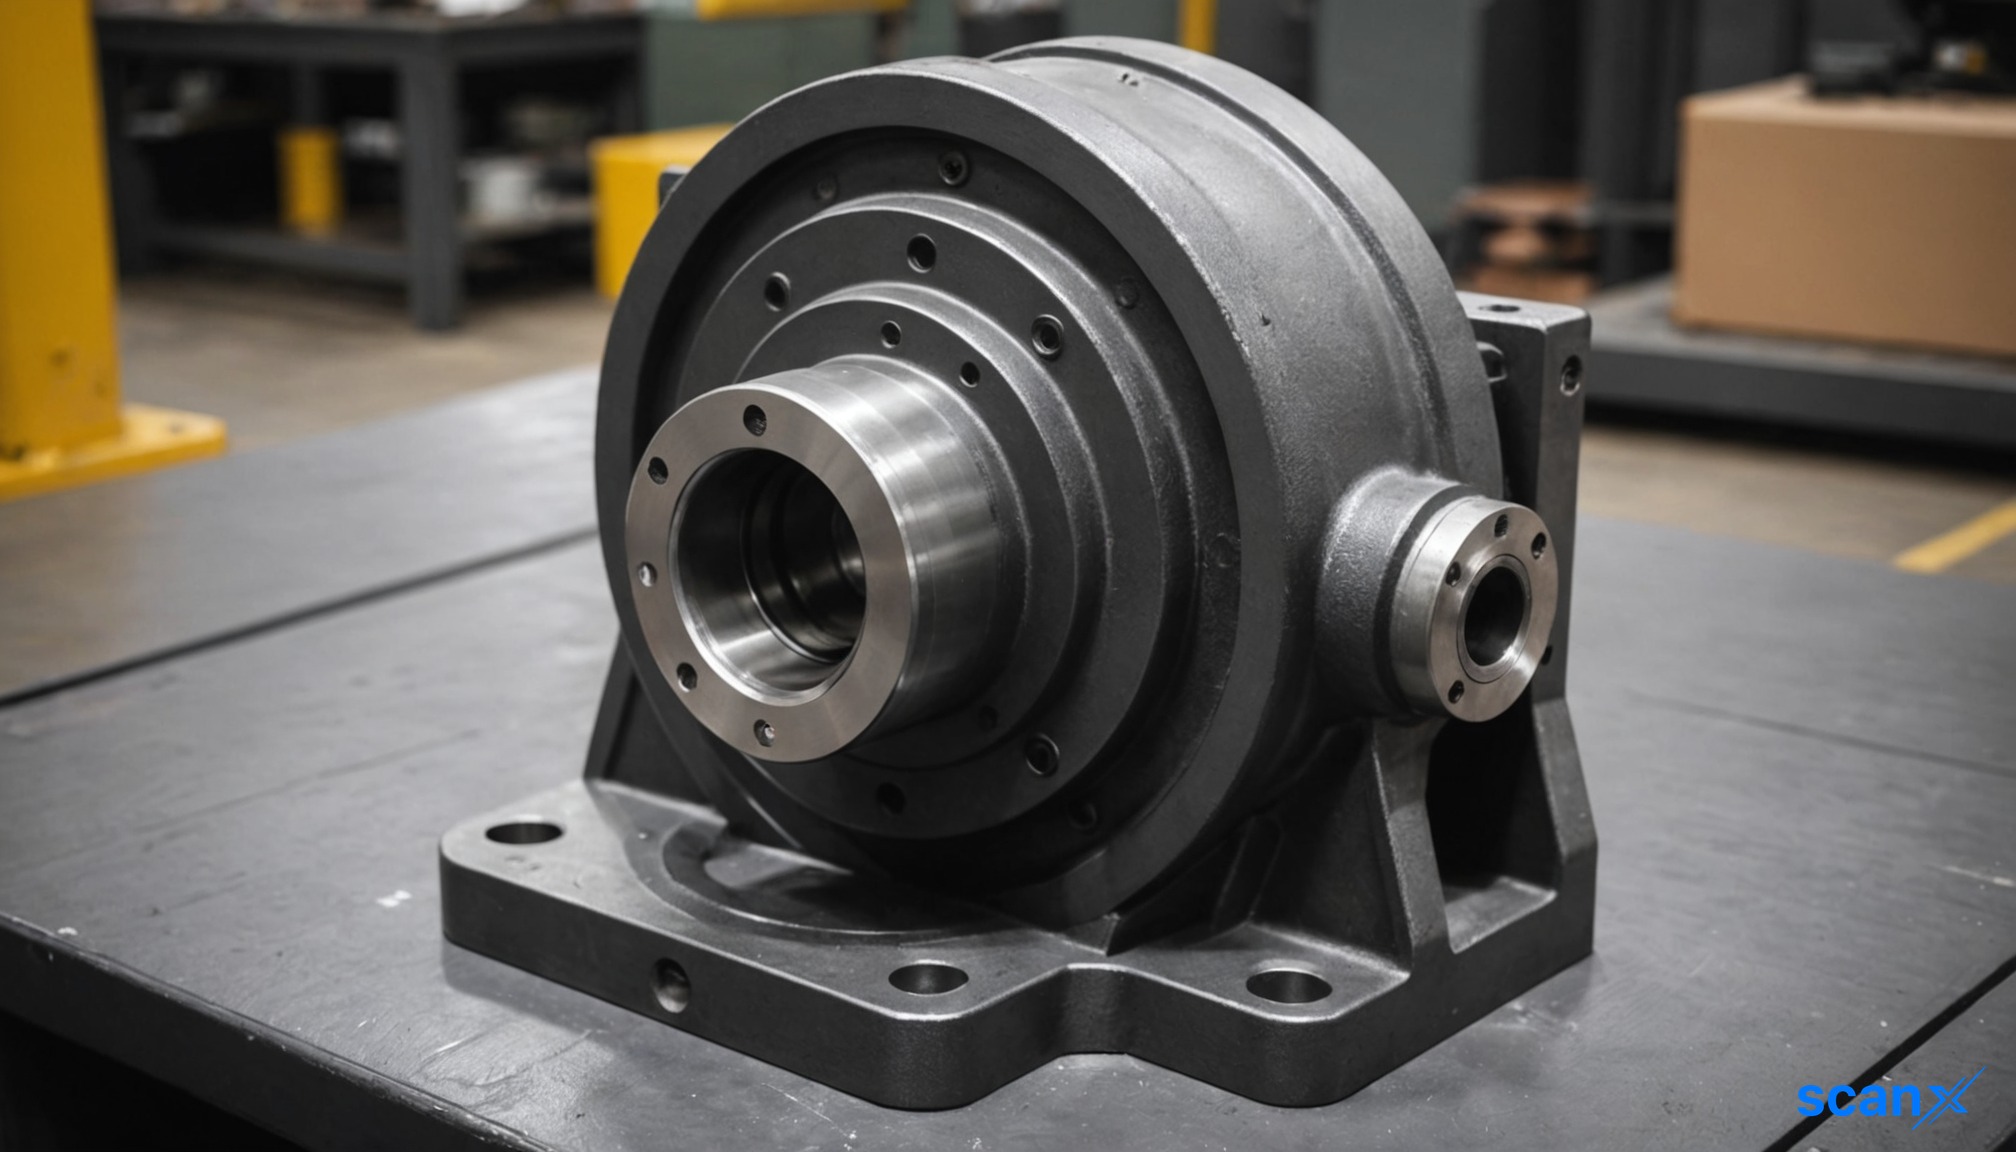
*this image is generated using AI for illustrative purposes only.
Jainex Aamcol Limited reported a net profit of ₹47.87 lakh for the second quarter of fiscal year 2026 (Q2FY26), down from ₹52.31 lakh in the preceding quarter. The company’s revenue from operations increased 15.6% year-on-year to ₹753.02 lakh, compared to ₹651.35 lakh in Q2FY25. The Board of Directors approved the unaudited standalone results on August 07, 2026, following a review by the Audit Committee.
The quarterly performance was characterized by stable top-line growth but pressured margins due to higher operational costs. While net sales grew significantly compared to the same period last year, total expenses rose to ₹105.06 lakh from ₹95.46 lakh in Q2FY25. Finance costs remained a significant burden at ₹201.63 lakh, up from ₹184.62 lakh in the prior year period. The statutory auditor, R K Jagetiya & Co, issued an unmodified opinion on the financial statements.
Financial Performance Overview
Jainex Aamcol’s profitability metrics show a slight contraction in efficiency during the quarter. The operating margin stood at 15.63%, down from 16.85% in Q1FY26 and 14.36% in Q2FY25. Net profit margin decreased to 6.36% from 6.77% in the previous quarter and 6.89% in the corresponding quarter of the previous fiscal year.
| Metric | Q2FY26 (₹ in Lakhs) | Q1FY26 (₹ in Lakhs) | Q2FY25 (₹ in Lakhs) |
|---|---|---|---|
| Revenue from Operations | 753.02 | 772.32 | 651.35 |
| Total Expenses | 105.06 | 123.42 | 95.46 |
| Profit Before Tax | 63.12 | 58.39 | 62.34 |
| Net Profit | 47.87 | 52.31 | 44.89 |
| Earnings Per Share (Basic) | ₹2.13 | ₹3.03 | ₹3.00 |
The company recorded exceptional items of ₹63.12 lakh in Q2FY26, which contributed to the profit before tax figure. In contrast, the profit before exceptional items and tax was ₹694.85 lakh, indicating that the core operational profitability remains robust despite the inclusion of these specific items in the final PBT calculation as per the filing structure.
Balance Sheet and Ratios
The company’s debt profile saw changes during the quarter. Total borrowings increased to ₹1,469.40 lakh from ₹782.24 lakh in Q1FY26, leading to a rise in the debt-equity ratio to 0.83 times from 0.45 times. However, this remains lower than the 1.53 times recorded in Q2FY25. The debt service coverage ratio (DSCR) declined to 0.50 times from 0.75 times in the previous quarter, reflecting the impact of higher debt servicing requirements against current cash flows.
| Ratio | Q2FY26 | Q1FY26 | Q2FY25 |
|---|---|---|---|
| Debt-Equity Ratio | 0.83 | 0.45 | 1.53 |
| Current Ratio | 1.48 | 1.47 | 1.22 |
| Interest Service Coverage | 4.29 | 3.60 | 7.84 |
| Operating Margin (%) | 15.63% | 16.85% | 14.36% |
Net worth increased to ₹1,771 lakh from ₹1,723 lakh in the previous quarter. The current ratio improved slightly to 1.48 times, indicating adequate short-term liquidity to meet immediate obligations. The interest service coverage ratio improved to 4.29 times from 3.60 times in Q1FY26, suggesting better ability to cover interest expenses from operating profits despite the rise in absolute finance costs.
What the Numbers Show
A key observation from the filing is the concentration risk inherent in Jainex Aamcol’s business model. Gear cutting tools contribute over 93% of the company’s revenue, a figure unchanged from the previous year. This high dependency means that any volatility in the industrial tooling sector directly impacts the company’s financial stability. While revenue growth is evident, the divergence between rising revenue and declining net margins suggests that input cost inflation or pricing pressures are eroding profitability. The increase in other manufacturing and operating expenses, which turned negative in value (-₹106.97 lakh) likely due to accounting adjustments or credits not present in the prior year, also distorts the direct comparison of operational efficiency. Investors should monitor whether the current revenue growth can sustain the elevated debt levels without further compressing margins.
Historical Stock Returns for Jainex Aamcol
| 1 Day | 5 Days | 1 Month | 6 Months | 1 Year | 5 Years |
|---|---|---|---|---|---|
| 0.0% | +1.55% | +13.46% | +59.83% | +14.20% | +300.96% |

How does management plan to mitigate the margin compression caused by rising operational and finance costs in the upcoming quarters?
What specific strategies will Jainex Aamcol employ to diversify its revenue base beyond the 93% dependency on gear cutting tools?
Given the significant increase in total borrowings to ₹1,469.40 lakh, what is the company's roadmap for debt reduction or refinancing?
 17
17









 Access 50+ Readymade Screeners
  Use 200+ Custom Filters
  Get Full Market Insights





