

Bansal Wire Q2FY27 Results: Sales volume rises 12.44% YoY to 1,28,867 MT


- Bansal Wire Industries achieved record Q2FY27 sales volume of 1,28,867 MT
- Quarterly volume rose 12.44% YoY from 1,14,609 MT in Q2FY26
- H1FY27 sales volume grew 10.10% YoY to 2,40,812 MT
- Q2 volumes expanded sequentially from 1,11,945 MT in Q1FY27

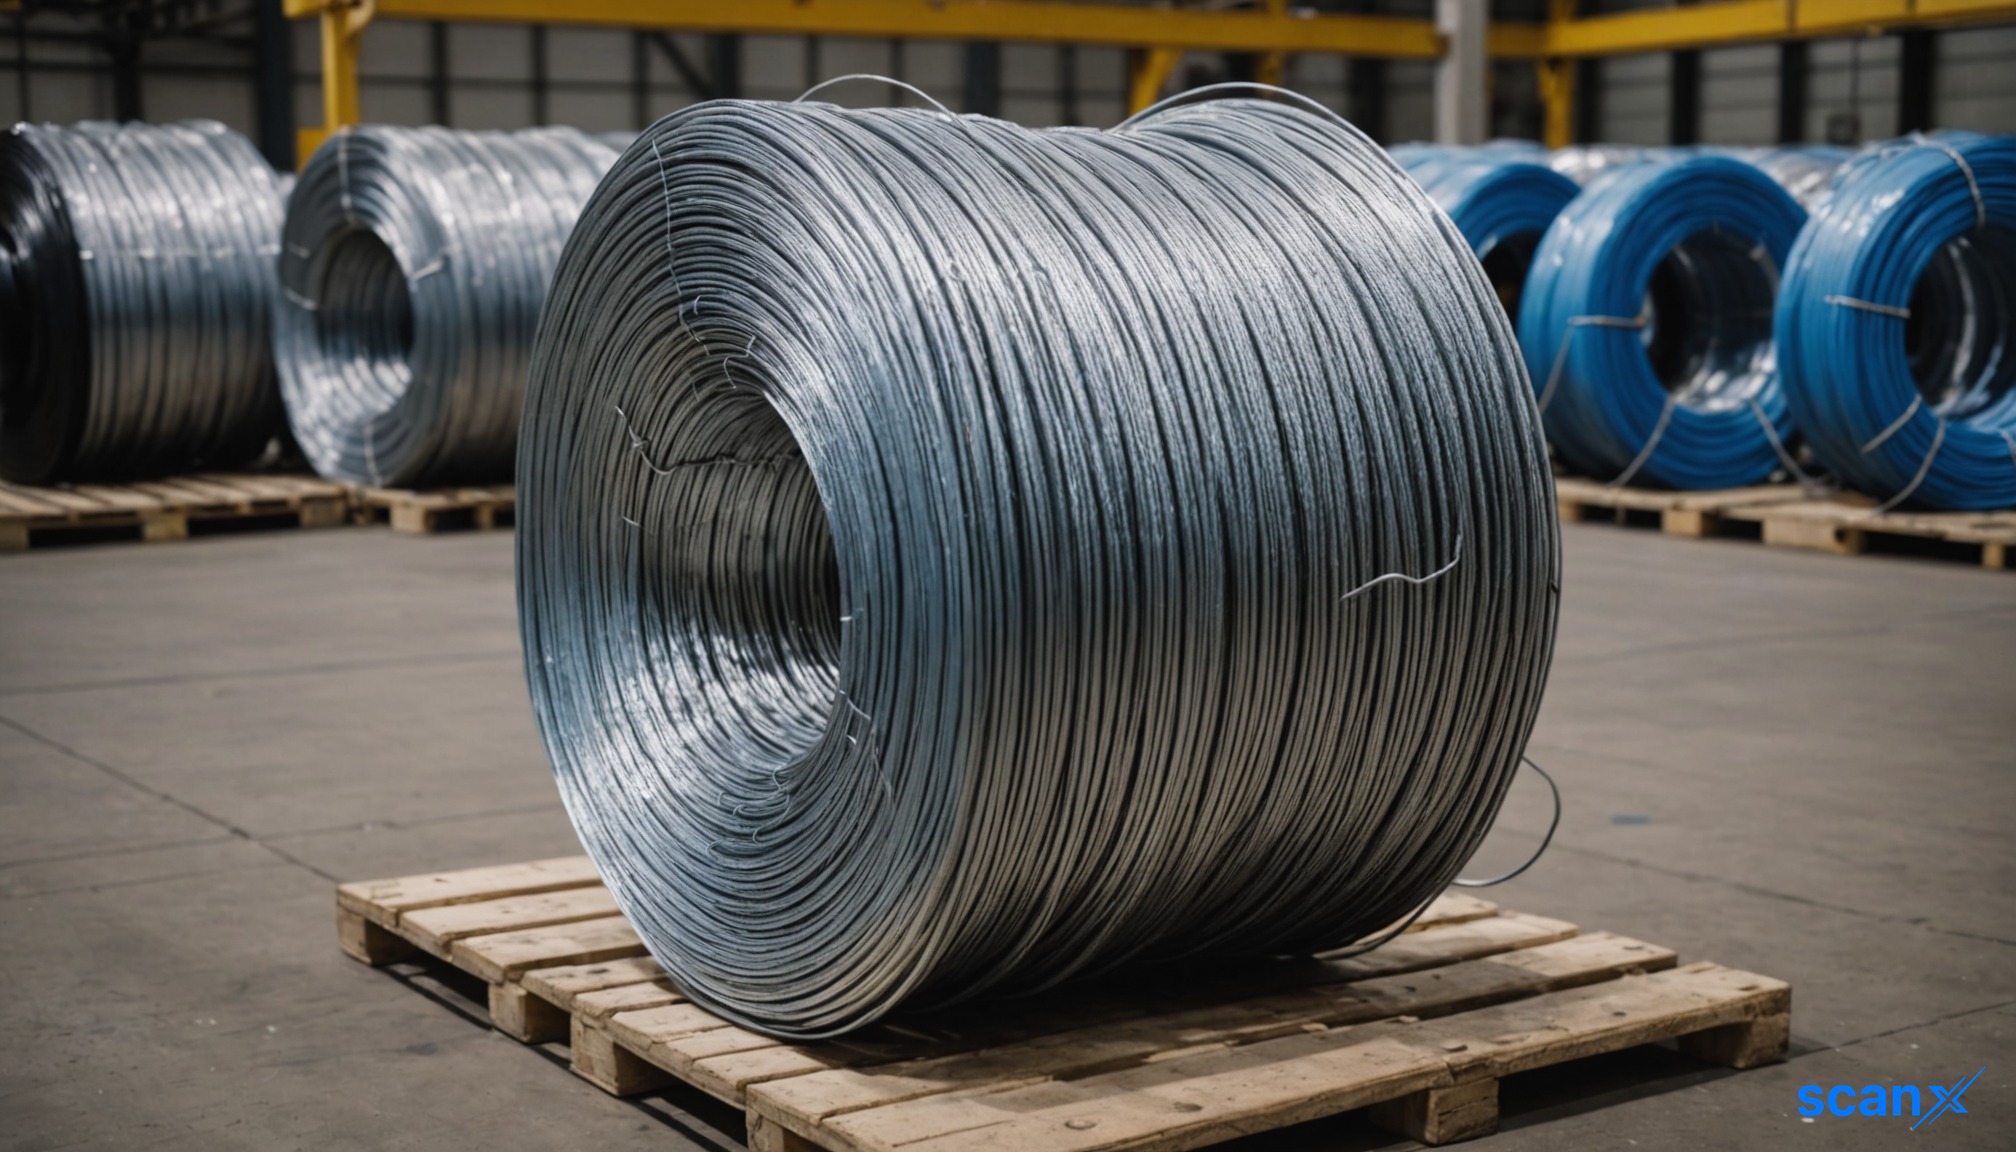

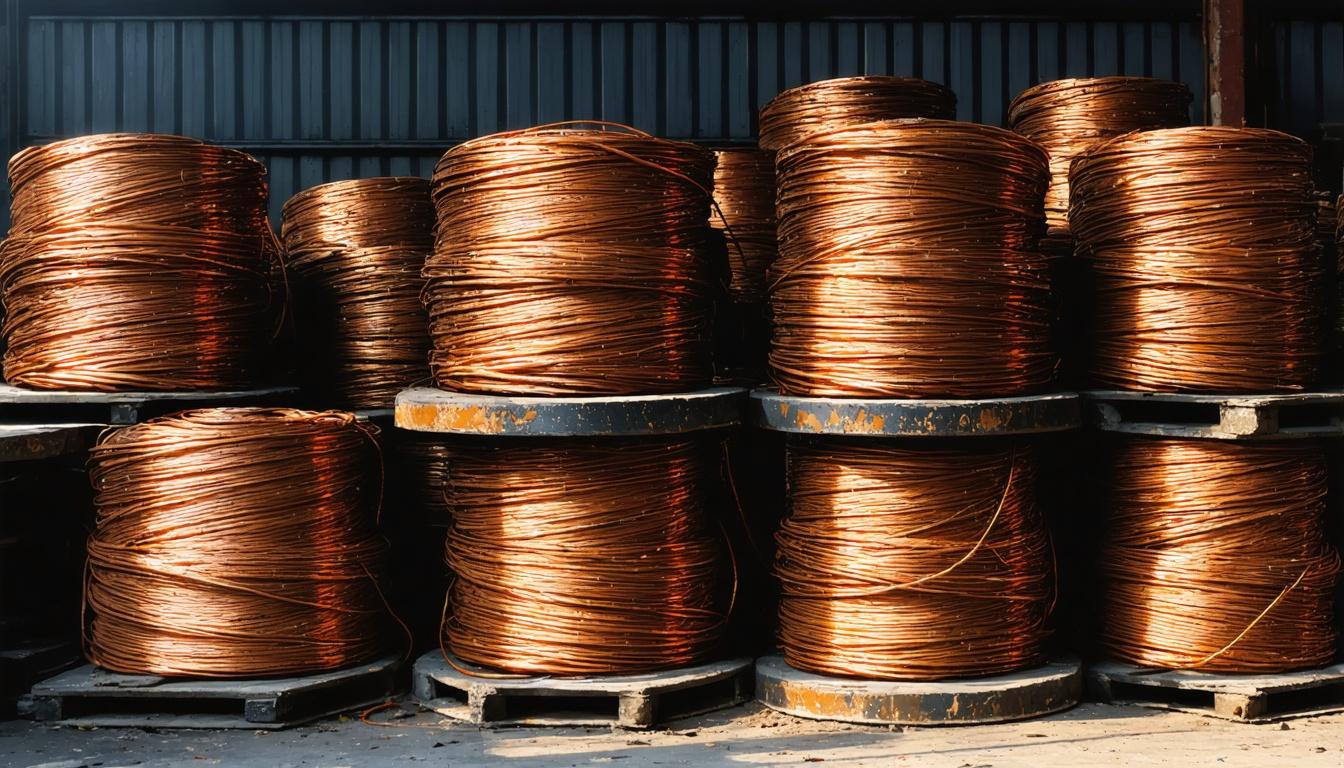
*this image is generated using AI for illustrative purposes only.
Bansal Wire Industries Limited reported its highest-ever quarterly sales volume of 1,28,867 MT in Q2FY27, reflecting a 12.44% year-on-year increase from the previous year's corresponding quarter.
The steel wire manufacturer also recorded its highest-ever half-yearly sales volume for H1FY27 at 2,40,812 MT, growing 10.10% YoY compared to 2,18,709 MT in H1FY26. The company attributed this performance to encouraging business momentum and market traction during the period.
Volume performance overview
The company's Q2FY27 volume of 1,28,867 MT represents a significant jump from the 1,14,609 MT recorded in Q2FY26. Sequentially, volumes expanded from 1,11,945 MT in Q1FY27, indicating strong quarter-on-quarter growth as well.
| Period | Total Volume (MT) | YoY Change |
|---|---|---|
| Q2FY27 | 1,28,867 | +12.44% |
| Q2FY26 | 1,14,609 | - |
| H1FY27 | 2,40,812 | +10.10% |
| H1FY26 | 2,18,709 | - |
| FY26 Full Year | 4,58,054 | - |
What the numbers show
A comparison of the half-yearly data reveals that the second quarter contributed disproportionately to the first-half growth. While H1FY27 saw a 10.10% YoY rise, the Q2FY27 standalone growth was higher at 12.44%. This suggests an acceleration in demand or capacity utilization in the second quarter compared to the first, which helped lift the overall half-yearly average. The H1FY27 volume of 2,40,812 MT already accounts for over 52% of the total FY26 volume of 4,58,054 MT, indicating a robust start to the fiscal year.
Historical Stock Returns for Bansal Wire Industries
| 1 Day | 5 Days | 1 Month | 6 Months | 1 Year | 5 Years |
|---|---|---|---|---|---|
| -0.88% | +1.49% | +0.82% | +42.52% | -5.27% | -8.49% |

How will Bansal Wire's capacity utilization rates evolve in H2FY27 to sustain the current volume growth trajectory?
What impact will fluctuating raw material costs have on the company's margins given the strong volume-led growth?
Which specific end-user sectors are driving the accelerated demand observed in Q2FY27 compared to Q1?
 19
19









 Create Custom Screeners
  Access 200+ Pre-built Filters
  Use 50+ Readymade Screener





