

Clean electricity supplied 40% of new energy demand in 2025


- Global clean energy investment hit a record $2.1 trillion in 2025
- Renewables supplied 99% of new electricity generation growth
- Clean power covered only 40% of total new energy demand
- Grid bottlenecks block 375 GW of renewables in Europe
- US fossil capacity additions surged 71% in 2025-2026

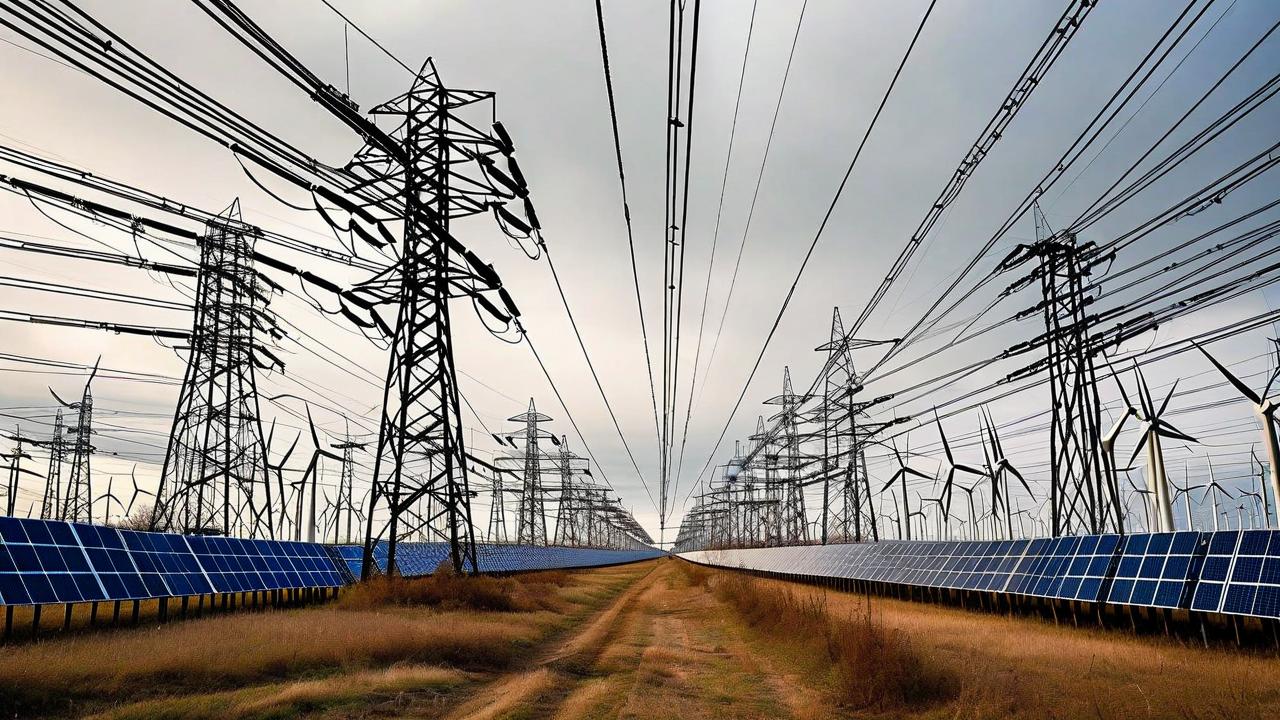

*this image is generated using AI for illustrative purposes only.
Global clean energy investment reached a record $2.1 trillion in 2025, yet greenhouse gas emissions are only plateauing. Renewables supplied 99% of the growth in global electricity generation, but this covered just 40% of the rise in total global energy demand.
The Energy Transitions Commission (ETC) published its Energy Transition Monitor 2026 on Sept. 2, 2026, highlighting a divergence between rapid clean power deployment and stagnant emissions. While solar, batteries, and electric vehicles outperformed forecasts, overall demand for both fossil and clean energy expanded simultaneously. This growth was driven by data centres, higher cooling needs, and heavy industry.
What the Numbers Show
The data reveals a structural mismatch between supply growth and final consumption. Although renewables accounted for nearly all new electricity generation, electricity constitutes only one-fifth of total final energy use. Consequently, the surge in clean power addressed less than half of the incremental energy demand, leaving fossil fuels to supply the remaining 60%. This dynamic explains why emissions are not falling despite record capital flows into green technology.
A Two-Speed Transition
The report identifies a bifurcation in abatement progress:
- 60% of global emissions: Primarily from power generation and road transport, these sectors are being addressed by clean electrification at little or no extra cost.
- 40% of global emissions: Sourced from aviation, shipping, heavy industry, and agriculture, these areas require solutions with a green cost premium or those at early commercial stages.
Grid capacity remains a critical bottleneck. In Europe, approximately 375 GW of renewables and 455 GW of battery storage are stuck in connection queues. In the United States, roughly 2,300 GW await grid connection. China curtailed nearly 10% of its wind and solar output in the first half of 2026 due to grid constraints.
Regional Divergences
Progress varies significantly across major economies:
| Region | Key Metric | Status |
|---|---|---|
| China | EV sales share | 56% of new passenger vehicle sales in 2025 |
| US | Fossil capacity | Additions surged 71% in 2025-2026 |
| EU/UK | Permitting backlog | 375 GW renewables stuck in queues |
| India | Electricity demand | Growing 6.4% annually |
China supplies 83% of the world’s renewable-energy equipment and installed more than half of global wind and solar capacity. In contrast, the US saw federal actions cancel 21 GW of clean energy since January 2025, while fossil capacity additions rose sharply. India records the fastest electricity demand growth among major economies at 6.4% per year, though new clean capacity is absorbed by this demand rather than displacing coal.
Unaddressed Levers
Four key levers for emissions reduction remain largely unaddressed: coal use, methane emissions, deforestation, and the scale-up of carbon removals. Adair Turner, Co-Chair of ETC, noted that deployment speed alone will not cut emissions without removing grid bottlenecks and securing buyer commitments for clean industrial products.

How will the persistent grid connection backlogs in Europe and the US impact the projected timeline for achieving net-zero emissions targets?
What specific policy interventions or technological breakthroughs are required to make green hydrogen and carbon capture viable for hard-to-abate sectors like aviation and heavy industry?
Given the surge in US fossil fuel capacity additions, how might this shift alter global energy trade dynamics and investment flows in emerging markets?
 19
19





 Access 50+ Readymade Screeners
  Use 200+ Custom Filters
  Get Full Market Insights





