NewsGrasim Industries Reports Rs 804.55 Crore Net Profit in Q2, All Paint Plants Now Operational
Grasim Industries Reports Rs 804.55 Crore Net Profit in Q2, All Paint Plants Now Operational


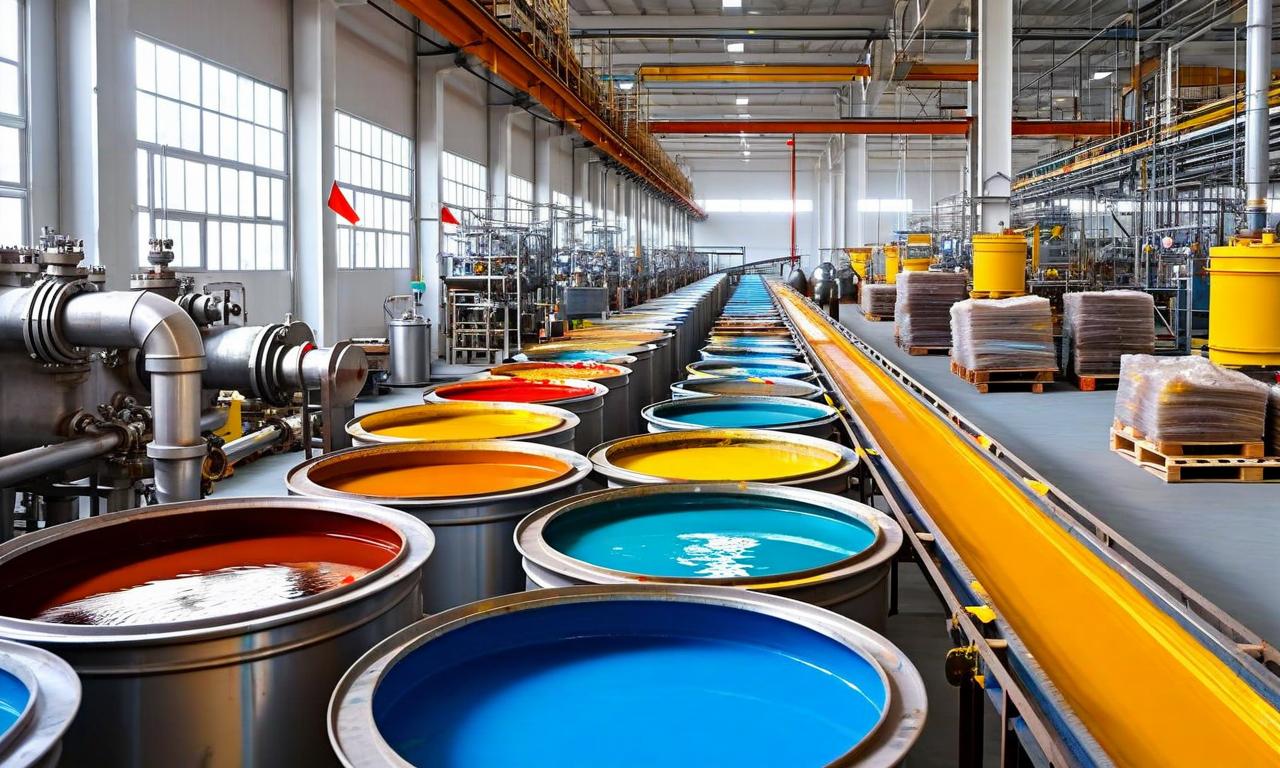
Grasim Industries posted a net profit of Rs 804.55 crore for Q2, reversing a loss from the previous quarter. Revenue increased to Rs 10,394.92 crore. The company's paint plant in Kharagpur started commercial production on October 15, bringing all six green-field plants into operation with a total decorative paints capacity of 1,332 Million Litres Per Annum under the Birla Opus brand. The Board approved the unaudited financial results on November 5.

*this image is generated using AI for illustrative purposes only.
Grasim Industries Limited , a flagship company of the Aditya Birla Group, has reported a strong financial performance for the quarter ended September 30. The company posted a net profit of Rs 804.55 crore, marking a significant turnaround from a loss of Rs 118.18 crore in the previous quarter.
Revenue Growth
The company's revenue from operations increased to Rs 10,394.92 crore, up from Rs 9,283.37 crore in the prior quarter. This substantial growth in revenue demonstrates Grasim's robust market position and effective business strategies across its diverse portfolio.
Paint Business Milestone
In a significant development for its paint business, Grasim Industries announced that its paint plant at Kharagpur commenced commercial production on October 15. This milestone brings all six of the company's green-field plants into operation, with the total decorative paints capacity reaching 1,332 Million Litres Per Annum under the Birla Opus brand.
Financial Highlights
| Metric | Value |
|---|---|
| Net Profit | Rs 804.55 crore |
| Revenue from Operations | Rs 10,394.92 crore |
| Total Comprehensive Income | Rs 1,408.39 crore |
| Basic Earnings Per Share | Rs 11.86 |
Board Approval
The Board of Directors approved the unaudited financial results at a meeting held on November 5.
Outlook
With strong financial results and the successful operationalization of all its paint plants, Grasim Industries appears well-positioned for continued growth. The company's focus on diversification and operational efficiency may contribute to its performance in the coming quarters.
Historical Stock Returns for Grasim Industries
| 1 Day | 5 Days | 1 Month | 6 Months | 1 Year | 5 Years |
|---|---|---|---|---|---|
| -0.42% | +1.70% | -0.28% | +15.74% | +15.48% | +100.93% |
 18
18