

York Exports Q1FY27 net loss widens to ₹164.97 lakh, revenue falls 40%


York Exports Limited posted a standalone net loss of ₹164.97 lakh in Q1FY27, reversing a profit of ₹10.01 lakh in Q1FY26. Revenue dropped 40.5% to ₹322.15 lakh. Consolidated net loss widened to ₹151.85 lakh from a profit of ₹14.53 lakh. Operating cash flow remained positive at ₹79.05 lakh due to increased payables and borrowings.


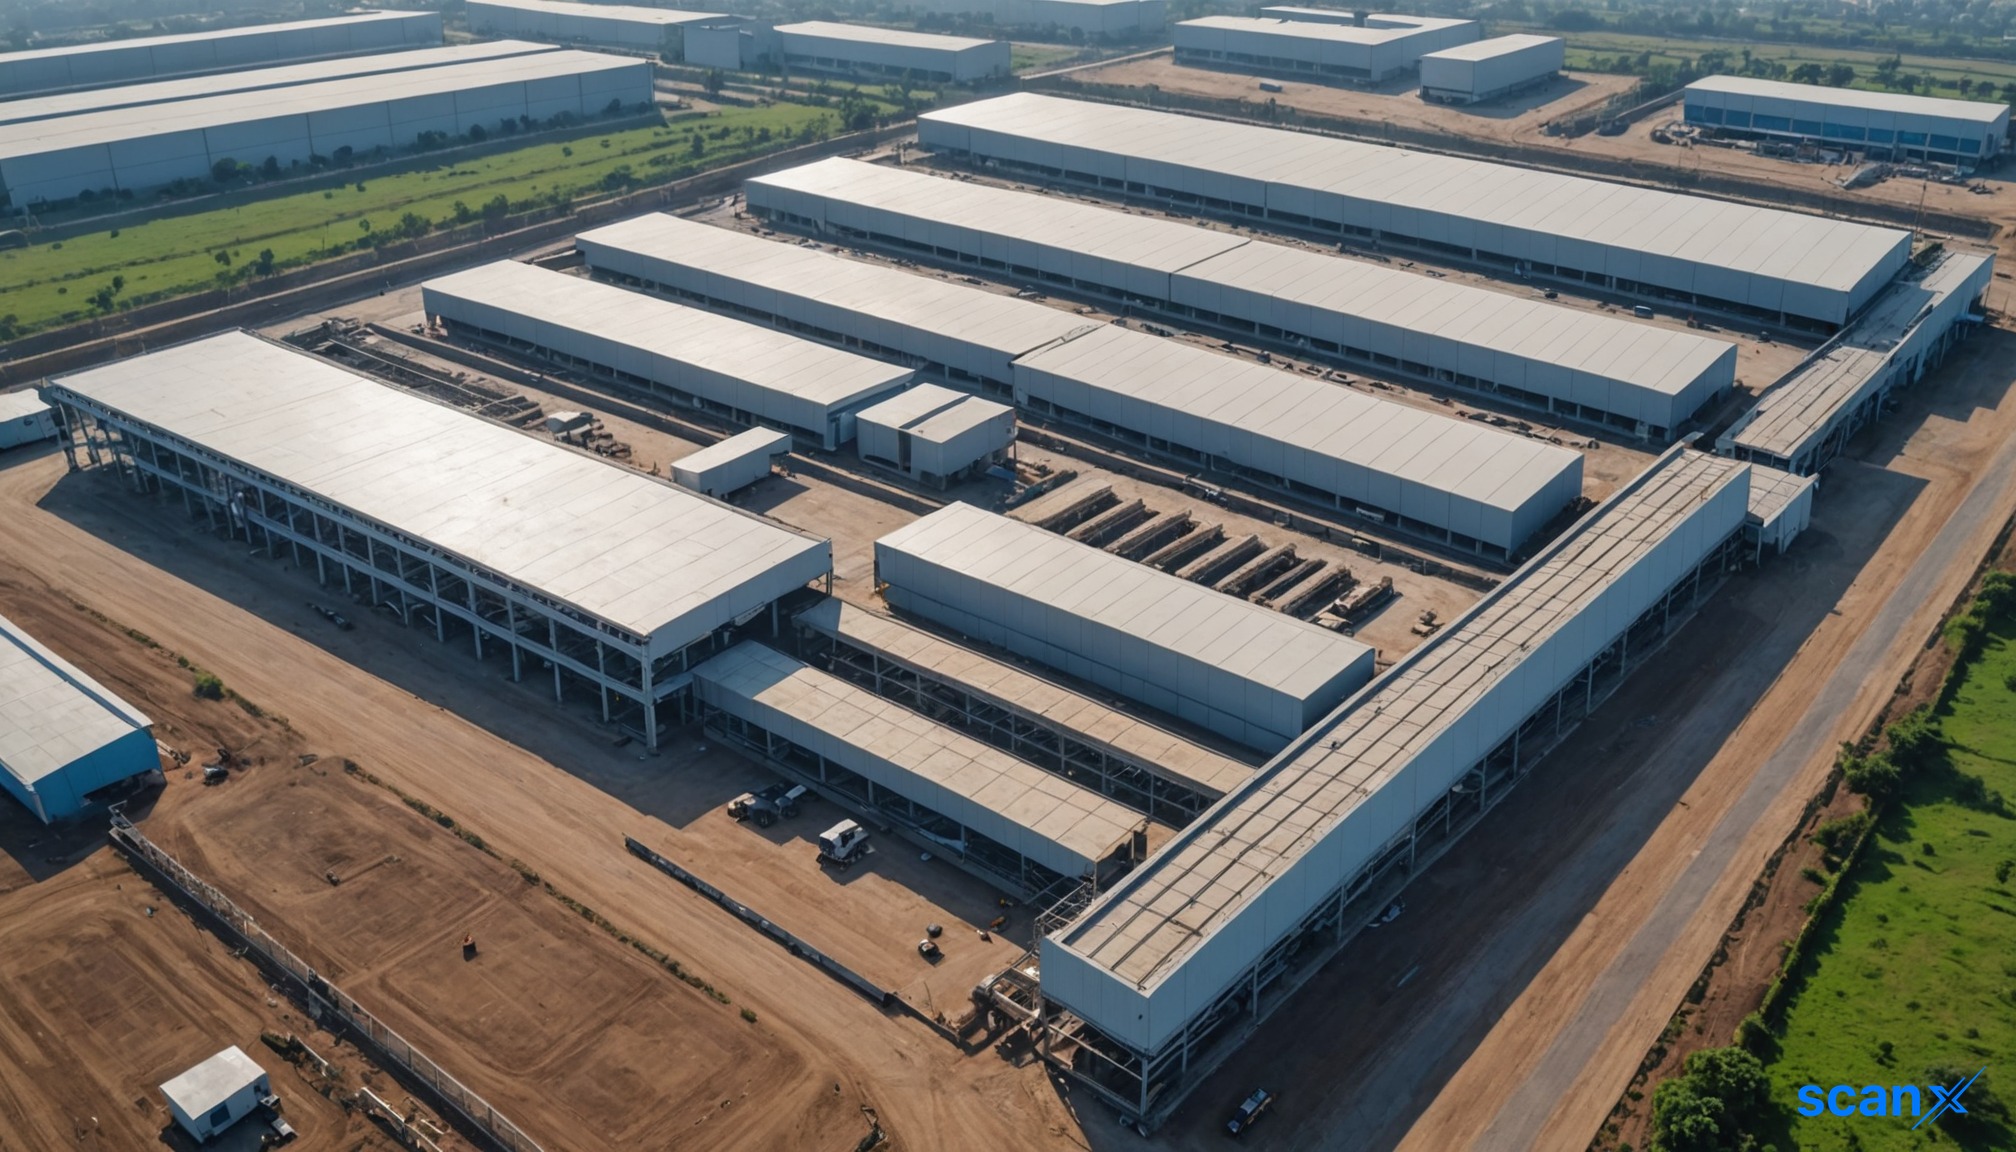
*this image is generated using AI for illustrative purposes only.
York Exports Limited reported a significant deterioration in profitability for the first quarter of FY27, with standalone net loss widening to ₹164.97 lakh compared to a net profit of ₹10.01 lakh in Q1FY26. The Ludhiana-based knitted garments manufacturer saw its revenue from operations contract by over 40% year-on-year to ₹322.15 lakh, reflecting softening demand or operational scaling back during the period.
On a consolidated basis, the group reported a net loss of ₹151.85 lakh for the quarter ended June 30, 2026, up from a net profit of ₹14.53 lakh in the corresponding period last year. However, the consolidated bottom line was partially cushioned by a share of profit from its associate, York Oil and Fats Private Limited, which contributed ₹13.12 lakh, down from ₹530.54 lakh in FY26.
Operational Metrics and Costs
The decline in revenue coincided with a complex cost structure. While total expenses decreased to ₹492.93 lakh from ₹529.68 lakh in Q1FY25, this reduction was largely driven by a credit of ₹662.63 lakh from changes in inventories, indicating stock build-up rather than sales conversion.
Finance costs remained a significant burden, rising to ₹100.72 lakh from ₹88.41 lakh in the previous year’s quarter. Employee benefits expense declined to ₹171.45 lakh from ₹205.81 lakh, suggesting some cost containment efforts in human resources.
| Metric | Q1FY27 (₹ Lakh) | Q1FY26 (₹ Lakh) | Change |
|---|---|---|---|
| Revenue from Operations | 322.15 | 541.48 | -40.5% |
| Total Expenses | 492.93 | 529.68 | -6.9% |
| Finance Costs | 100.72 | 88.41 | +13.9% |
| Standalone Net Profit/(Loss) | (164.97) | 10.01 | Turn to Loss |
| Consolidated Net Profit/(Loss) | (151.85) | 14.53 | Turn to Loss |
Cash Flow and Balance Sheet Signals
Despite the operating loss, the company generated positive cash flow from operating activities of ₹79.05 lakh on a standalone basis, compared to an outflow of ₹1,443.99 lakh in FY26. This improvement was driven by an increase in trade payables (₹477.85 lakh) and current borrowings (₹402.66 lakh), offsetting the cash tied up in inventory increases of ₹649.75 lakh and trade receivables of ₹151.56 lakh.
The consolidated cash flow from operations showed a similar pattern, generating ₹92.17 lakh. Investing activities consumed ₹2.35 lakh on a standalone basis, primarily due to acquisitions of property, plant, and equipment. Financing activities resulted in a net outflow of ₹66.41 lakh, dominated by interest payments of ₹100.72 lakh and repayment of long-term borrowings of ₹34.31 lakh.
What the Numbers Show
The divergence between the standalone loss and positive operating cash flow highlights a reliance on working capital management to sustain liquidity. The substantial increase in trade payables and current borrowings funded the inventory build-up, as revenue generation failed to convert existing stock into cash. Furthermore, the associate company, York Oil and Fats Private Limited, continues to be a critical profit center; its contribution of ₹13.12 lakh mitigated the group’s consolidated loss, although this share is significantly lower than the ₹530.54 lakh recorded in the full year FY26.
The Board of Directors, chaired by Managing Director Ashwani Dhawan, approved the unaudited financial results in a meeting held on August 14, 2026. The results were reviewed by Nanda & Bhatia Chartered Accountants.
Historical Stock Returns for York Exports
| 1 Day | 5 Days | 1 Month | 6 Months | 1 Year | 5 Years |
|---|---|---|---|---|---|
| +3.98% | -3.75% | -12.93% | -6.51% | -13.07% | -21.92% |

What specific strategies is York Exports planning to implement to convert the significant inventory build-up into sales revenue in Q2FY27?
How sustainable is the current reliance on increasing trade payables and short-term borrowings to maintain positive operating cash flow?
Given the sharp decline in York Oil and Fats' contribution, what factors are driving the reduced profitability at the associate level, and will this trend persist?
 20
20






 Access 50+ Readymade Screeners
  Use 200+ Custom Filters
  Get Full Market Insights





