

Sri Nachammai Cotton Mills reports ₹14.75 lakh net loss in Q1FY27


Sri Nachammai Cotton Mills Ltd reported a net loss of ₹14.75 lakh for Q1FY27, a significant improvement over the previous quarter's loss of ₹506.76 lakh. Revenue stood at ₹1,294.59 lakh. The operational improvement is driven by reduced power costs via solar energy, though weak yarn demand persists.


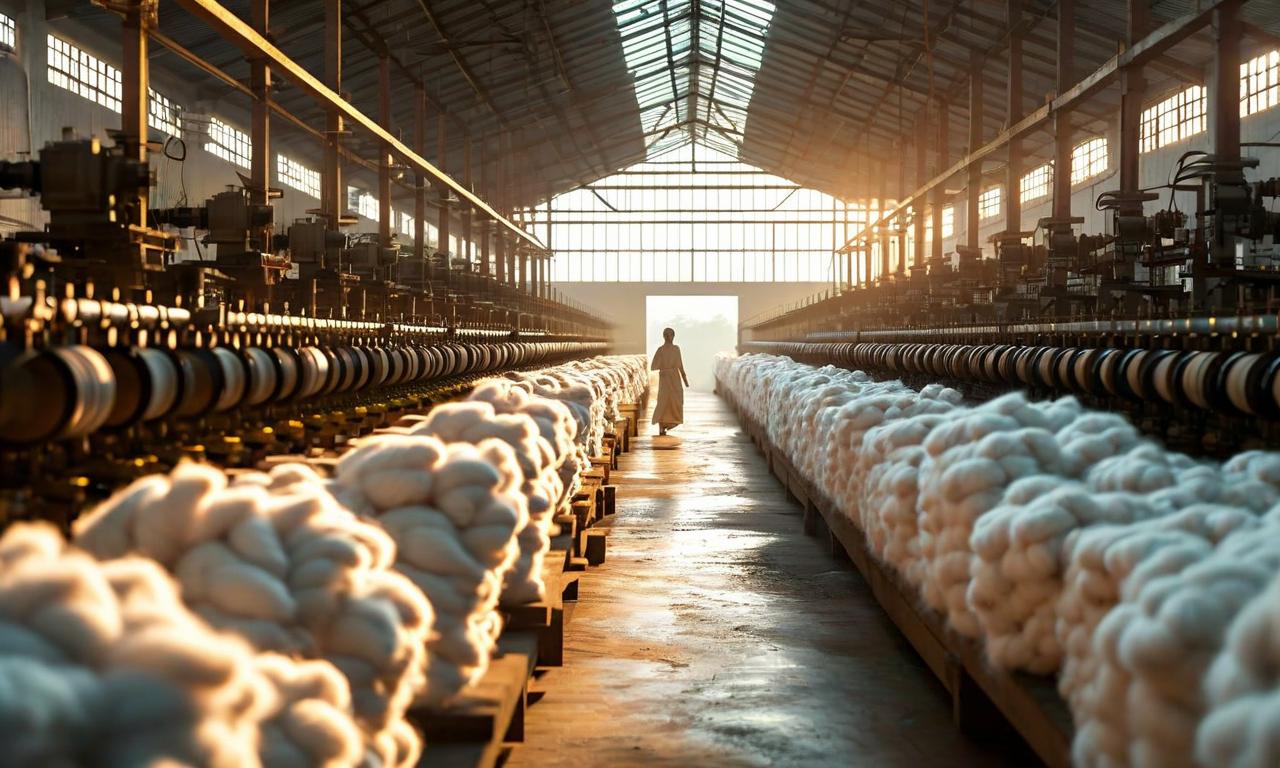
*this image is generated using AI for illustrative purposes only.
Sri Nachammai Cotton Mills reported a net loss of ₹14.75 lakh for the quarter ended June 30, 2026 (Q1FY27), a significant improvement from the net loss of ₹506.76 lakh in the preceding quarter (Q4FY26). The company’s revenue from operations stood at ₹1,294.59 lakh in Q1FY27, compared to ₹1,390.92 lakh in the same quarter last year (Q1FY25), which had included a one-time exceptional gain. The narrowing operational loss highlights the impact of cost-control measures, particularly in power consumption, despite persistent challenges in yarn demand and pricing disparities.
The Board of Directors approved the unaudited standalone financial results on August 11, 2026, in compliance with Regulation 47 of the SEBI (Listing Obligations and Disclosure Requirements) Regulations, 2015. The results were reviewed by the Audit Committee and subjected to a limited review by the statutory auditors, Gopalaiyer and Subramanian. The company operates under Ind AS (Indian Accounting Standards) as prescribed under Section 133 of the Companies Act, 2013.
Financial Performance Overview
Revenue from operations declined slightly year-on-year to ₹1,294.59 lakh in Q1FY27, down from ₹1,400.51 lakh in Q1FY25. The decline is attributed to poor demand for yarn and a continued disparity between cotton input prices and yarn selling prices. Consequently, the company operated only one unit for three shifts during the quarter, leading to adjusted depreciation charges. Total expenses were not explicitly itemized in the summary table but resulted in an operating loss before tax of ₹13.27 lakh. The net loss after tax was ₹14.75 lakh, compared to a profit of ₹538.35 lakh in Q1FY25, which was heavily influenced by a non-recurring exceptional item.
| Particulars | Q1FY27 (₹ Lakh) | Q4FY26 (₹ Lakh) | Q1FY25 (₹ Lakh) | FY26 Audited (₹ Lakh) |
|---|---|---|---|---|
| Revenue from Operations | 1,294.59 | 1,496.03 | 1,400.51 | 6,477.29 |
| Profit/(Loss) Before Tax | (13.27) | (19.19) | (131.93)* | (693.54)* |
| Net Profit/(Loss) After Tax | (14.75) | (506.76) | 538.35 | (379.75) |
| EPS (Basic) | (0.34) | (11.82) | 12.56 | (8.86) |
Note: Q1FY25 figures before tax exclude exceptional items; after-tax figures include them.
Operational Efficiency and Cost Control
A key driver of the improved bottom line was the reduction in power and fuel expenses, which fell to ₹92.21 lakh in Q1FY27 from ₹143.50 lakh in Q1FY25. This saving is primarily due to the self-consumption of electricity generated from the company’s solar power plant, commissioned during FY25 and FY26. Management stated that various cost-control and efficiency-enhancement measures are being implemented across operations to reduce losses and improve profitability. The company also noted that it is installing an additional 2 MW solar capacity this year to further reduce future power costs.
What the Numbers Show
The comparison between Q1FY27 and Q1FY25 reveals a structural shift in earnings quality. While the headline net result appears worse due to the absence of the ₹6.58 crore exceptional gain in Q1FY25 (arising from the derecognition of redeemable preference shares), the underlying operational loss has narrowed considerably. In Q1FY25, excluding the exceptional item, the company incurred a pre-tax loss of ₹131.93 lakh. The current quarter’s pre-tax loss of ₹13.27 lakh suggests that operational efficiencies, particularly in energy costs, are beginning to offset weak demand dynamics. The drastic cut in power expenses provides a positive margin tailwind, although the company continues to face headwinds from low yarn demand and high raw material costs.
Historical Stock Returns for Sri Nachammai Cotton Mills
| 1 Day | 5 Days | 1 Month | 6 Months | 1 Year | 5 Years |
|---|---|---|---|---|---|
| +5.43% | -5.04% | -1.82% | -18.59% | -26.40% | -34.00% |

How will the upcoming installation of the additional 2 MW solar capacity impact the company's long-term power cost structure and margin stability?
What specific strategies is management employing to address the persistent disparity between cotton input prices and yarn selling prices?
Given the current low yarn demand, are there plans to diversify product offerings or explore new export markets to stabilize revenue streams?
 18
18












 Create Custom Screeners
  Access 200+ Pre-built Filters
  Use 50+ Readymade Screener





