

Solex Energy board recommends ₹0.55 dividend, approves BSE listing


- Board recommends final dividend of ₹0.55 per share for FY26
- Approves listing of equity shares on BSE Mainboard Platform
- AGM scheduled for September 22, 2026 to approve dividend and borrowing limits
- Proposed borrowing limit set at ₹2,000 crore for capital expenditure
- Related party transactions with subsidiary capped at ₹300 crore for FY27



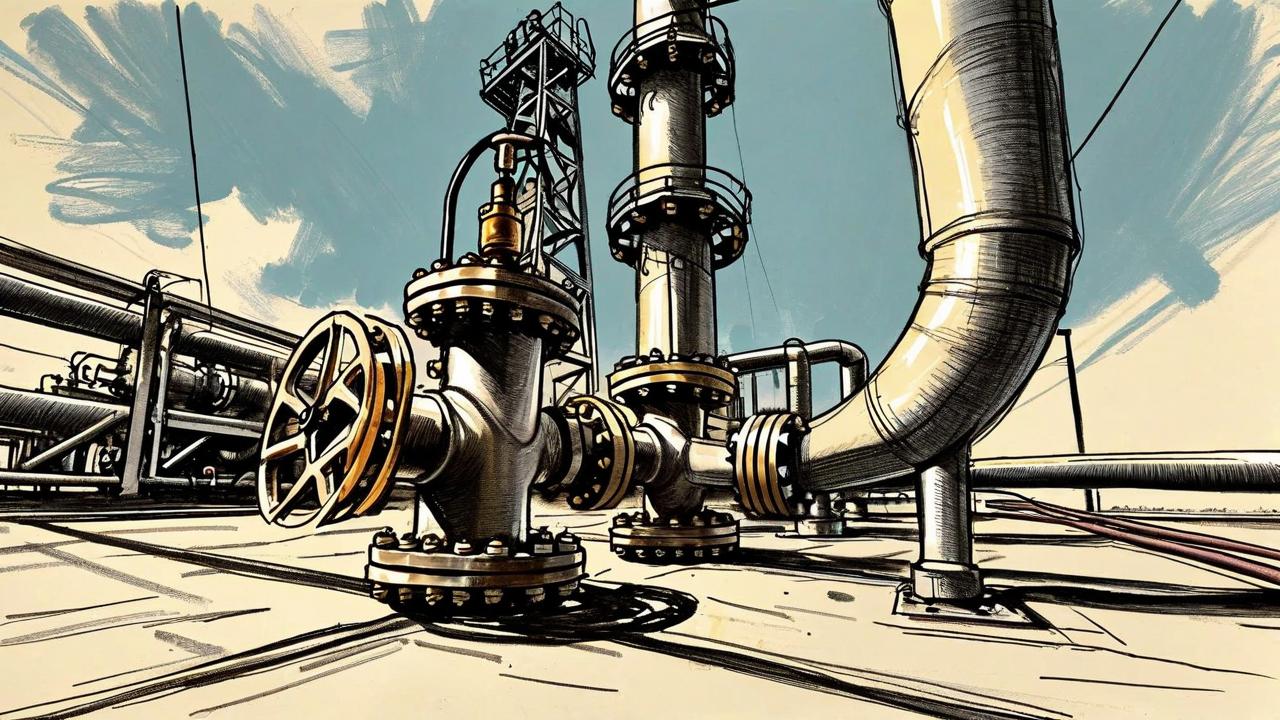
*this image is generated using AI for illustrative purposes only.
Solex Energy has recommended a final dividend of ₹0.55 per equity share for FY26 and approved its listing on the Bombay Stock Exchange. The Board of Directors made these announcements following a meeting held on June 18, 2026.
The dividend recommendation is subject to shareholder approval at the upcoming Annual General Meeting. If approved, the payout will be dispatched within 30 days of declaration. The record date for determining eligibility will be intimated separately.
Listing and Corporate Actions
The Board approved the proposal to list existing equity shares on the Mainboard Platform of BSE Limited, subject to necessary regulatory approvals. This follows the company’s presence on the National Stock Exchange.
Solex Energy has scheduled its 12th Annual General Meeting for September 22, 2026. The meeting will address key corporate actions including the proposed dividend and enhanced borrowing limits.
What the Numbers Show
The proposed borrowing limit of ₹2,000 crore represents a substantial expansion in financial flexibility. This ceiling allows the company to raise funds from various sources, including banks and financial institutions, beyond its paid-up share capital and free reserves. The move aligns with the company's stated objectives to support capital expenditure and strategic investments.
Governance and Remuneration
The Board seeks approval for the re-appointment of Dr. Chetan Shah as Chairman and Managing Director for a further term of three years, commencing August 6, 2027. His remuneration is capped at ₹50 lakh per month, with total benefits not exceeding ₹6 crore per annum.
Mr. Piyush Chandak is also up for re-appointment as Whole-Time Director for three years starting September 1, 2027. His monthly CTC is set at ₹2.5 lakh, with an annual cap of ₹30 lakh on total remuneration and benefits.
Related Party Transactions
Shareholders will vote on material related party transactions with subsidiary Solex Green Energy Private Limited. The proposed aggregate value for FY27 is capped at ₹300 crore. These transactions include the sale and purchase of goods and services, expected to constitute 18.54% of the listed entity's annual consolidated turnover from the preceding year.
Voting Details
The remote e-voting period begins on September 19, 2026, at 9:00 am and ends on September 21, 2026, at 5:00 pm. The register of members will remain closed from September 16 to September 21, 2026.
Historical Stock Returns for Solex Energy
| 1 Day | 5 Days | 1 Month | 6 Months | 1 Year | 5 Years |
|---|---|---|---|---|---|
| -1.18% | -4.29% | -6.55% | -51.07% | -55.98% | 0.0% |

How will the new ₹2,000 crore borrowing limit impact Solex Energy's debt-to-equity ratio and credit rating outlook?
What specific strategic investments or capital expenditure projects is the company planning to fund with the expanded financial flexibility?
How might the dual listing on both NSE and BSE affect Solex Energy's liquidity and market valuation compared to its current NSE-only presence?
 17
17







 Access Market Heat-map & Insights
  Create, Save & Share your Screener
  Use 200+ Screening Filters





