

Sanstar FY26 Results: Net profit falls 21%, capacity doubles to 2,350 TPD


- Revenue declined 18.1% YoY to ₹784.6 crore amid pricing pressures
- Net profit fell 21.3% to ₹34.5 crore, but gross margin expanded to 30.1%
- Installed capacity doubled to 2,350 TPD following Dhule expansion
- Net debt reduced to ₹3.7 crore from ₹93.7 crore last year
- Export diversification reduced Asia's share from 68% to 49%

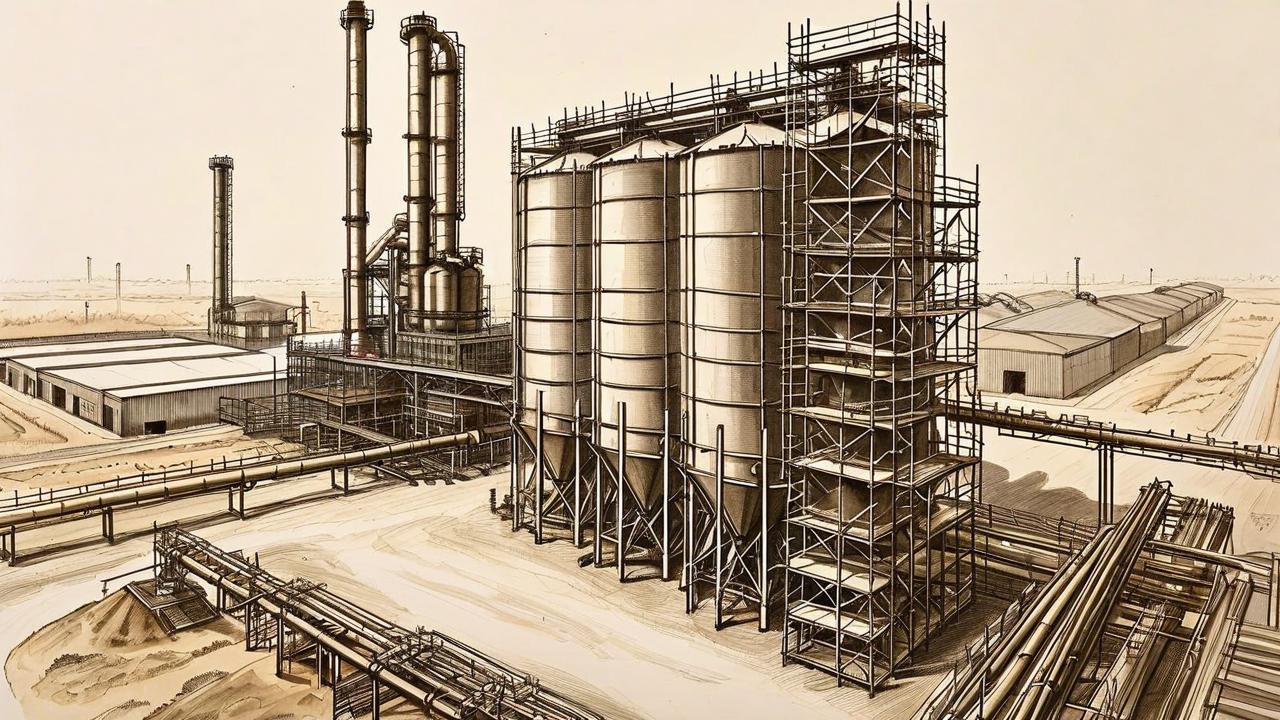

*this image is generated using AI for illustrative purposes only.
Sanstar reported a 18.1% decline in revenue from operations to ₹784.6 crore for the financial year ended March 31, 2026, compared to ₹957.4 crore in the previous year. Profit after tax fell 21.3% to ₹34.5 crore, reflecting headwinds in native starch pricing and lower volumes.
The maize-based specialty products manufacturer navigated a challenging first half marked by Chinese export surges into Southeast Asia and an annual maintenance shutdown. Despite the topline pressure, gross margin expanded to 30.1% from 25.9%, as the company optimized its product mix and controlled costs.
Capacity Expansion and Balance Sheet
A key milestone for the year was the commissioning of a 1,250 tonnes per day (TPD) expansion at its Dhule facility. Total installed capacity rose from 1,100 TPD to 2,350 TPD, funded largely by IPO proceeds. This positions the company as India’s second-largest maize-based specialty products manufacturer.
The balance sheet strengthened significantly. Finance costs dropped 81% to ₹1.4 crore, and net debt improved from ₹93.7 crore to a near-neutral ₹3.7 crore, even after deploying ₹178.5 crore in investing activities.
Financial Performance
| Metric | FY26 | FY25 | Change |
|---|---|---|---|
| Revenue | ₹784.6 crore | ₹957.4 crore | -18.1% |
| Gross Profit | ₹236.2 crore | ₹247.8 crore* | -3.3% |
| EBITDA | ₹38.0 crore | ₹56.0 crore | -32.1% |
| PAT | ₹34.5 crore | ₹43.8 crore | -21.3% |
Note: Gross profit figure derived from Chairman's message; EBITDA/PAT from KPI tables.
What the Numbers Show
While revenue contracted sharply, the divergence between top-line decline and stable gross profit indicates successful margin preservation. Gross margin expanded by 420 basis points to 30.1%, suggesting that higher-value products or cost efficiencies offset the volume loss in commoditized native starch. Additionally, the drastic reduction in finance costs (from ₹7.5 crore to ₹1.4 crore) contributed disproportionately to bottom-line stability relative to operating profit declines.
Strategic Outlook
Exports accounted for 34% of revenue across 41 countries. Geographically, Asia’s share of exports fell from 68% to 49%, as the company diversified into the Americas, Africa, and the Middle East to mitigate regional pricing pressures.
Looking ahead, management expects the upcoming derivatives facility at Dhule, slated for commissioning in FY27, to further stabilize margins through value-added products like liquid glucose and dextrose. The Board has not recommended a dividend for FY26, opting to retain earnings for internal deployment.
Historical Stock Returns for Sanstar
| 1 Day | 5 Days | 1 Month | 6 Months | 1 Year | 5 Years |
|---|---|---|---|---|---|
| -2.84% | -3.87% | -9.16% | +22.19% | +1.90% | -13.96% |

How will the upcoming FY27 commissioning of the derivatives facility impact Sanstar's revenue mix and margin stability against volatile native starch prices?
What specific strategies is Sanstar employing to defend its market share in Southeast Asia amidst continued aggressive pricing from Chinese exporters?
With net debt reduced to near-neutral levels, will management prioritize further capacity expansion or debt-free balance sheet retention for potential M&A opportunities?
 17
17







 Access 50+ Readymade Screeners
  Use 200+ Custom Filters
  Get Full Market Insights





