

RSWM FY26 Results: Net Profit ₹52 Crore vs Loss of ₹41 Crore in FY25


RSWM Limited's FY26 Integrated Annual Report marks a decisive turnaround with PAT of ₹51.98 Crore against a loss of ₹41.28 Crore in FY25, while EBITDA expanded 40.5% to ₹327.12 Crore on revenue of ₹4,553.98 Crore. The RSWM 2.0 strategy drove margin expansion of 231 basis points to 7.1%, total borrowings reduction of ₹112 Crore to ₹1,509.67 Crore, and ROCE improvement from 2.53% to 5.69%. Strategic initiatives including the ₹427 Crore LNJ GreenPET facility, ₹92 Crore knit expansion, 70% renewable energy sourcing, and closure of the Chhata spinning unit collectively repositioned the Company from a volume-led commodity spinner toward a margin-focused, vertically integrated textile enterprise. India Ratings & Research revised the Company's outlook from Negative to Stable, affirming its IND A long-term issuer rating.

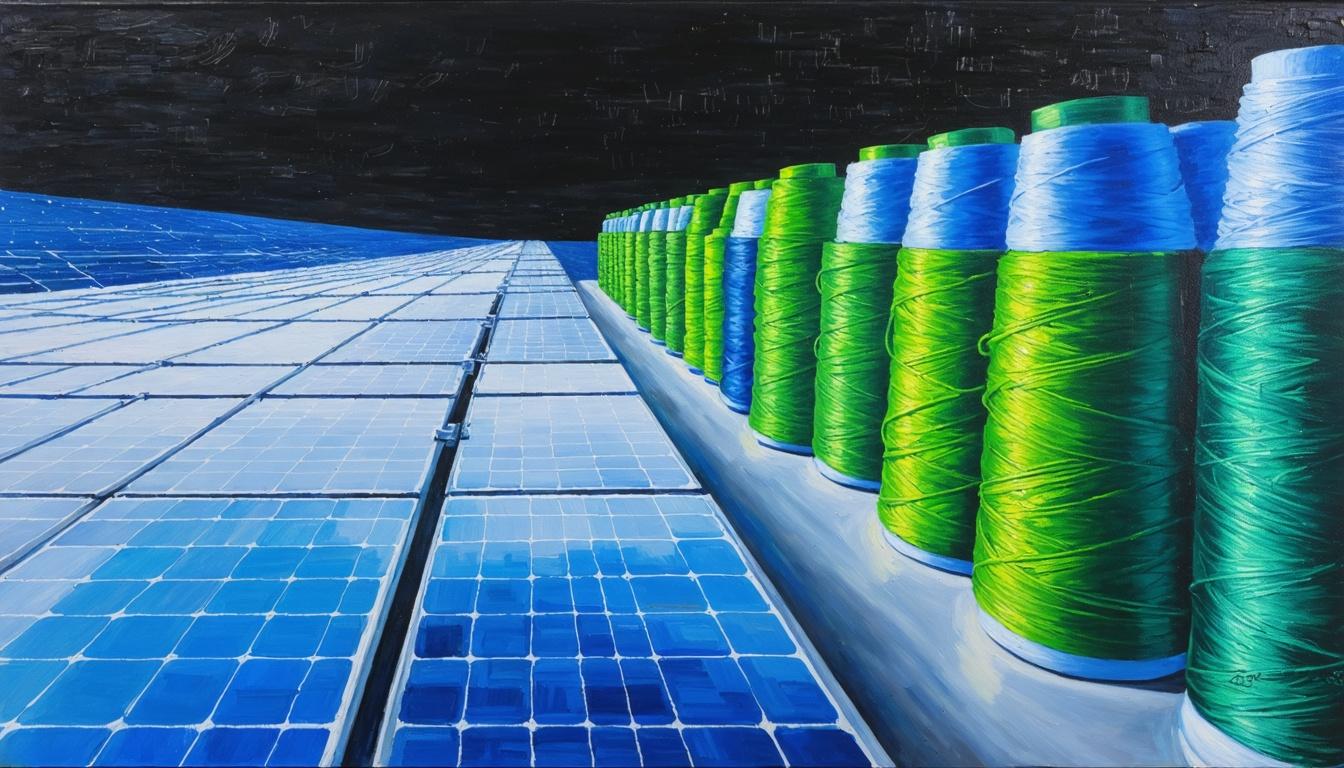

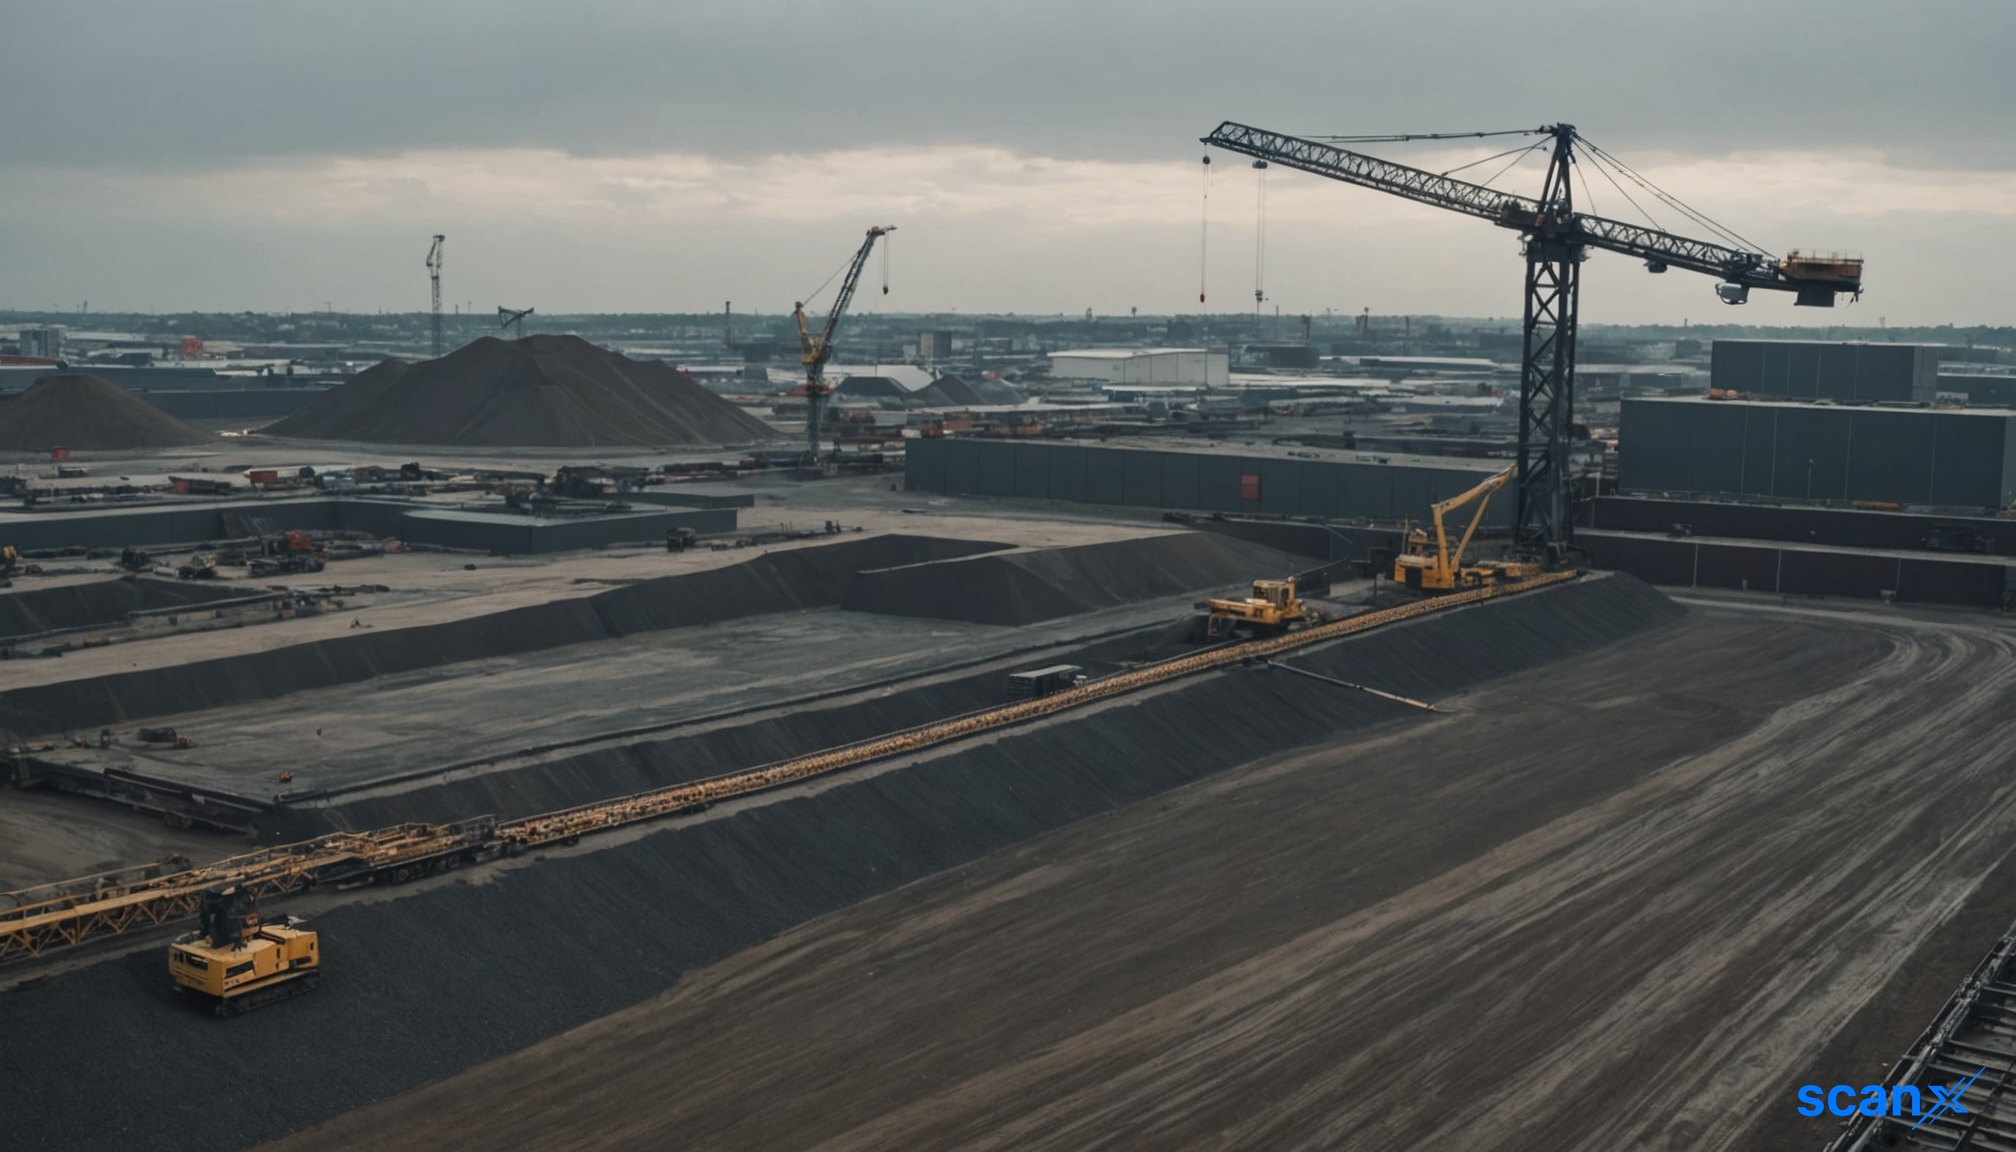
*this image is generated using AI for illustrative purposes only.
RSWM Limited , the flagship company of the LNJ Bhilwara Group, has released its Integrated Annual Report for the financial year ended March 31, 2026, marking a decisive turnaround from loss to profit under its RSWM 2.0 transformation framework. The Company reported a Net Profit After Tax of ₹51.98 Crore for FY26, compared to a Loss After Tax of ₹41.28 Crore in FY25, driven by disciplined cost control, strategic asset rationalisation, and a deliberate shift from volume-led to margin-focused operations.
Key Financial Performance — FY26
Despite a 5.6% year-on-year decline in revenue from operations to ₹4,553.98 Crore, the Company delivered meaningful margin expansion across all profitability metrics. The following table summarises the key financial results:
| Metric: | FY26 | FY25 | Change |
|---|---|---|---|
| Revenue from Operations: | ₹4,553.98 Crore | ₹4,825.29 Crore | (5.6%) |
| EBITDA: | ₹327.12 Crore | ₹232.79 Crore | +40.5% |
| EBITDA Margin: | 7.1% | 4.80% | +231 bps |
| Finance Cost: | ₹122.83 Crore | ₹135.29 Crore | (9.2%) |
| PAT: | ₹51.98 Crore | ₹(41.28) Crore | Turnaround |
| Total Borrowings: | ₹1,509.67 Crore | ₹1,621.58 Crore | (₹112 Crore) |
| Net Worth: | ₹1,371.65 Crore | ₹1,307.83 Crore | +₹63.82 Crore |
| Capital Employed: | ₹3,467.70 Crore | ₹3,524.78 Crore | — |
| ROCE: | 5.69% | 2.53% | +316 bps |
| Basic EPS (₹): | ₹11.04 | ₹(8.76) | Turnaround |
The reported PAT includes a one-time benefit of ₹22.66 Crore arising from the reassessment of deferred tax liabilities following the Company's election of the new concessional corporate tax rate of 25.17% effective FY27 under the Income Tax Act, 2025. Normalised PAT, excluding this tax adjustment, stood at approximately ₹29 Crore.
Other income rose 74.6% to ₹51 Crore, partly reflecting the monetisation of non-core assets. Gross profit improved to ₹1,753 Crore, up 1.4% year-on-year, with gross margin expanding by 246 basis points to 38.1%, supported by better raw material management with costs down 9.6% year-on-year.
RSWM 2.0 — Strategic Pillars Driving the Turnaround
The RSWM 2.0 framework, launched in FY26, rests on four interlocking pillars that guided operational and capital decisions through the year.
1. Cash Conservation and Liquidity Optimisation Working capital costs were held below 9%. Tactical engagement with the repo rate cycle — which compressed from 6.5% to 5.2% — delivered a ₹7 Crore finance cost saving. The ₹36 Crore preferential warrant subscription by the Promoter Group reaffirmed promoter conviction in the strategy.
2. Product and Market Mix Optimisation The conversion of 20,000 spindles at the Kharigram unit from grey to dyed yarn exemplifies the value-addition mandate. Value-added products currently contribute less than 20% of sales, representing significant runway for margin-accretive growth.
3. Forward Integration into Value-Added Segments A ₹92 Crore investment in the Knit division lifts capacity from 750 MT to 900 MT per month, with 120 MT of in-house printing capability added — a segment in which the Company previously had no footprint. European machinery acquired from BAKPL at ₹54 Crore brings energy-efficient equipment into the manufacturing network.
4. Operational Cost Rationalisation and Capital Allocation Discipline Renewable sources now power 70% of total energy consumption, anchored by a 60 MW round-the-clock partnership with Adani Green Energy Solutions and a 9.6 MW behind-the-meter solar installation. All thermal boilers are transitioning from coal to biofuels. The cumulative annualised benefit to the bottom line is estimated at ₹30–40 Crore. Year-on-year power and fuel expenses declined by ₹17.6 Crore.
Strategic Asset Rationalisation
Two pivotal decisions shaped the FY26 operational landscape:
| Decision: | Details |
|---|---|
| Chhata Spinning Closure: | Reduced topline by approximately ₹250 Crore; eliminated structurally low-margin volume |
| Jammu Project Withdrawal: | State-level subsidy delays and GST rationalisation compromised internal rate of return; capital redirected to higher-yield opportunities |
| Inventory Reduction: | 15.16% reduction (₹110.69 Crore) since March 2025 |
| Receivables Reduction: | ₹65.32 Crore reduction since March 2025 |
The Company also monetised non-viable spinning machines at the Chhata unit, its thermal power plant and surplus land at Jammu, converting dormant balance-sheet items into deployable capital.
Business Division Performance
The following table summarises key operational metrics across business divisions for FY26:
| Division: | Revenue | Production | Key Metric |
|---|---|---|---|
| Synthetic Yarn: | ₹2,172 Crore | 1,05,820 MT | Speciality yarn: 24% of production |
| Cotton Yarn: | ₹620 Crore | 25,591 MT | Positive bottom line in Q4FY26 |
| Denim Fabric: | — | 32,523 thousand metres | ~100% capacity utilisation |
| Knitted Fabrics: | — | 6,292 MT | Capacity expansion to 900 MT/month underway |
| Fibre Green (Recycled): | — | 8,452 tonnes sold | 50% of total polyester production |
The Denim Division achieved approximately 100% capacity utilisation against an industry average of approximately 70%, underscoring its operational agility and demand strength. The Synthetic Yarn division developed and sold 1,980 tonnes of specialised yarn variants per month during FY26.
New Growth Engines
LNJ GreenPET at Ratlam: RSWM acquired 100% equity shareholding in LNJ GreenPET Private Limited for a total consideration of ₹20.01 Crore. The subsidiary is setting up a greenfield facility in Ratlam, Madhya Pradesh, at an investment of ₹427 Crore to produce bottle-to-bottle, food-grade recycled PET (rPET) chips and granules using Starlinger European technology, funded through a 70:30 debt-equity structure. The project is expected to generate annual revenue of ₹475–500 Crore at full maturity.
The Ringas facility currently processes nearly 6.5 million PET bottles every day, with recycled polyester contributing 50% of total polyester production, up from less than 10% at inception.
Credit Rating and Corporate Governance
India Ratings & Research (Ind-Ra) revised the Company's outlook from Negative to Stable while affirming its long-term issuer rating at IND A. The Board comprised 11 Directors as at March 31, 2026, including 6 Independent Directors (54.54% of the Board) and 1 Woman Director. Five Board meetings were held during FY26 with 95% attendance.
| Committee: | Independent Directors (%) | Meetings (FY26) | Attendance |
|---|---|---|---|
| Audit Committee: | 100% | 5 | 100% |
| Nomination & Remuneration Committee: | 66.66% | 2 | 100% |
| Stakeholders Relationship Committee: | 50% | 4 | 100% |
| Risk Management Committee: | 66.66% | 2 | 100% |
| CSR Committee: | 33.33% | 4 | 100% |
The Board has not recommended any dividend on equity shares for the year ended March 31, 2026. An amount of ₹801.69 Crore has been carried over to the next year.
Annual General Meeting and Key Ratios
The 65th Annual General Meeting is scheduled for Wednesday, 26th August, 2026 at 2:00 PM via Video Conferencing/Other Audio-Visual Means. The record date for e-voting is 19th August, 2026.
Key financial ratios for FY26 versus FY25 are presented below:
| Ratio: | FY26 | FY25 | % Change |
|---|---|---|---|
| Debt Equity Ratio: | 1.10 | 1.24 | (11.29%) |
| Debt Service Coverage Ratio: | 1.28 | 0.82 | 56.10% |
| Interest Coverage Ratio: | 2.66 | 1.72 | 54.65% |
| Operating Profit Margin (%): | 7.10% | 4.80% | 47.30% |
| Net Profit Margin (%): | 1.13% | (0.85%) | 232.94% |
| Inventory Turnover (days): | 50 | 55 | (9.09%) |
| Debtor Turnover (days): | 51 | 53 | (3.77%) |
The Company's total contribution to the exchequer in terms of taxes and duties stood at ₹342.60 Crore for FY26. CSR expenditure for the year amounted to ₹32.26 Lakh, directed towards preventive healthcare, safe drinking water and promotion of education.
Historical Stock Returns for RSWM
| 1 Day | 5 Days | 1 Month | 6 Months | 1 Year | 5 Years |
|---|---|---|---|---|---|
| -0.01% | -2.53% | -6.18% | +59.33% | +41.55% | -8.58% |

How will the full commissioning of the ₹427 Crore LNJ GreenPET facility impact RSWM's revenue mix and margin profile by FY28?
What is the projected timeline for value-added products to exceed the current 20% sales contribution, and how will this shift affect overall EBITDA margins?
How might the transition from coal to biofuels and renewable energy sources influence RSWM's cost competitiveness against peers relying on thermal power?






 Access Market Heat-map & Insights
  Create, Save & Share your Screener
  Use 200+ Screening Filters





