

Purple Wave Infocom FY26 Results: Net profit up 48% to ₹1,342.70 lakh


- Net profit rose 48.2% YoY to ₹1,342.70 lakh for FY26
- Revenue grew 14.4% to ₹14,610.39 lakh with EBITDA margin expanding to 13.5%
- IPO raised ₹3,144.96 lakh, boosting net worth by 234.6% to ₹5,757.50 lakh
- Cash conversion cycle lengthened to 122 days due to inventory buildup
- Debt-equity ratio improved to 0.29x from 0.86x post-IPO



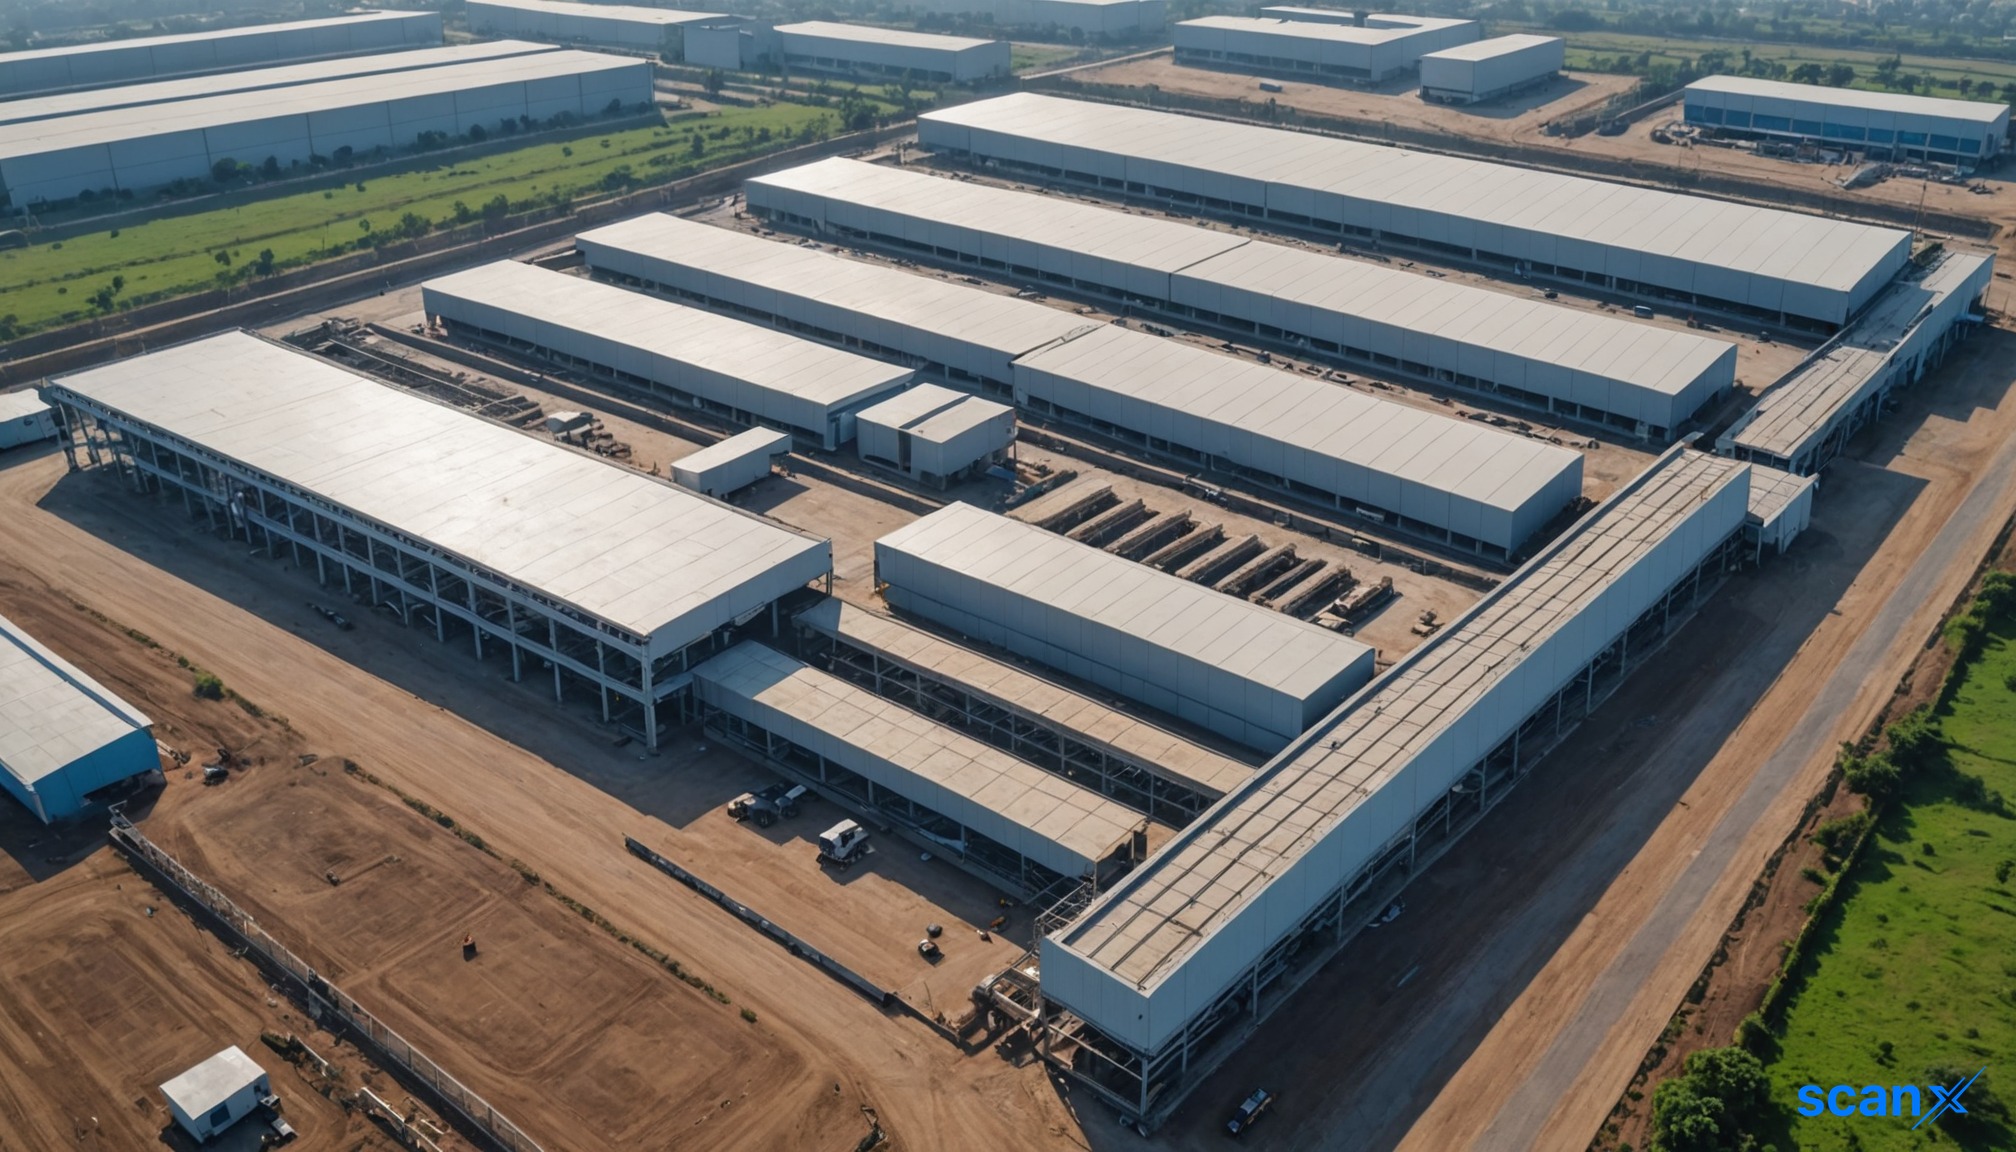
*this image is generated using AI for illustrative purposes only.
Purple Wave Infocom posted a net profit of ₹1,342.70 lakh for FY26, a 48.2% increase from the previous year's ₹906.23 lakh. The Pro AV integrator also saw revenue from operations grow by 14.4% to ₹14,610.39 lakh, driven by strong execution across corporate, retail, and government segments.
The company listed on the BSE SME platform in December 2025, raising ₹3,144.96 lakh through an initial public offering (IPO). This capital injection significantly strengthened the balance sheet, with total assets rising by 67.2% to ₹9,381.18 lakh and net worth expanding by 234.6% to ₹5,757.50 lakh.
Financial Performance
Revenue growth was accompanied by notable margin expansion. EBITDA grew by 40.2% to ₹1,975.28 lakh, pushing the EBITDA margin to 13.5% from 11.0% in FY25. Profit before tax (PBT) rose by 47.0% to ₹1,805.24 lakh.
| Metric | FY26 | FY25 | Change |
|---|---|---|---|
| Revenue | ₹14,610.39 lakh | ₹12,774.64 lakh | +14.4% |
| EBITDA | ₹1,975.28 lakh | ₹1,408.95 lakh | +40.2% |
| Net Profit | ₹1,342.70 lakh | ₹906.23 lakh | +48.2% |
Other income increased significantly to ₹22.21 lakh from ₹7.13 lakh, aided by interest income. Total expenses rose by 11.0% to ₹12,827.37 lakh, reflecting higher purchases and employee benefits but remaining well below the pace of revenue growth.
Balance Sheet & Cash Flow
The IPO proceeds were primarily utilized for capital expenditure and working capital needs. Property, plant, and equipment surged to ₹1,470.43 lakh from ₹99.11 lakh, indicating substantial investment in manufacturing infrastructure. Inventories more than doubled to ₹2,897.87 lakh to support order execution.
Leverage decreased sharply as equity funding replaced debt reliance. The debt-equity ratio improved to 0.29x from 0.86x. Current borrowings stood at ₹1,429.03 lakh, while non-current borrowings were ₹258.66 lakh. Cash and cash equivalents closed at ₹688.04 lakh.
What the Numbers Show
A key divergence in the data is the improvement in receivables efficiency despite revenue growth. Trade receivables remained broadly stable at ₹3,425.45 lakh (vs ₹3,435.22 lakh in FY25), reducing debtor days from 98 to 86 days. However, inventory days nearly doubled from 37 to 72 days, lengthening the cash conversion cycle to 122 days from 74 days. This suggests the company is building stock buffers to meet projected demand rather than facing collection pressure.
Corporate Developments
The company incorporated Nano Theatre Private Limited as a wholly-owned subsidiary on March 30, 2026. No business activities were undertaken by the subsidiary during the year. The Board proposed no dividend for FY26 to augment working capital. Additionally, the company seeks shareholder approval for related-party transactions with Purplewave India Private Limited and Nano Theatre Private Limited up to ₹15 crore each for FY27.
Historical Stock Returns for Purple Wave Infocom
| 1 Day | 5 Days | 1 Month | 6 Months | 1 Year | 5 Years |
|---|---|---|---|---|---|
| 0.0% | +14.84% | +11.86% | +341.80% | +248.70% | +248.70% |

How will the significant increase in inventory days from 37 to 72 impact Purple Wave's cash flow liquidity in the near term?
What specific strategic role is the newly incorporated subsidiary, Nano Theatre Private Limited, expected to play in FY27 and beyond?
Will the proposed related-party transactions with Purplewave India and Nano Theatre affect the company's operational independence or margin structure?
 15
15










 Access 50+ Readymade Screeners
  Use 200+ Custom Filters
  Get Full Market Insights





