

Mangalam Worldwide FY26 PAT Soars 70%; Board Recommends Dividend


Mangalam Worldwide Limited reported a 70% increase in FY26 PAT to ₹50.14 crore, with revenue growing 14% to ₹1,214.99 crore. The board recommended a final dividend of ₹0.30 per share, approved a proposal for BSE main board listing, and appointed M/s. S S Rawat & Co. as Internal Auditor and M/s. V. M. Patel & Associates as Cost Auditor for FY27.


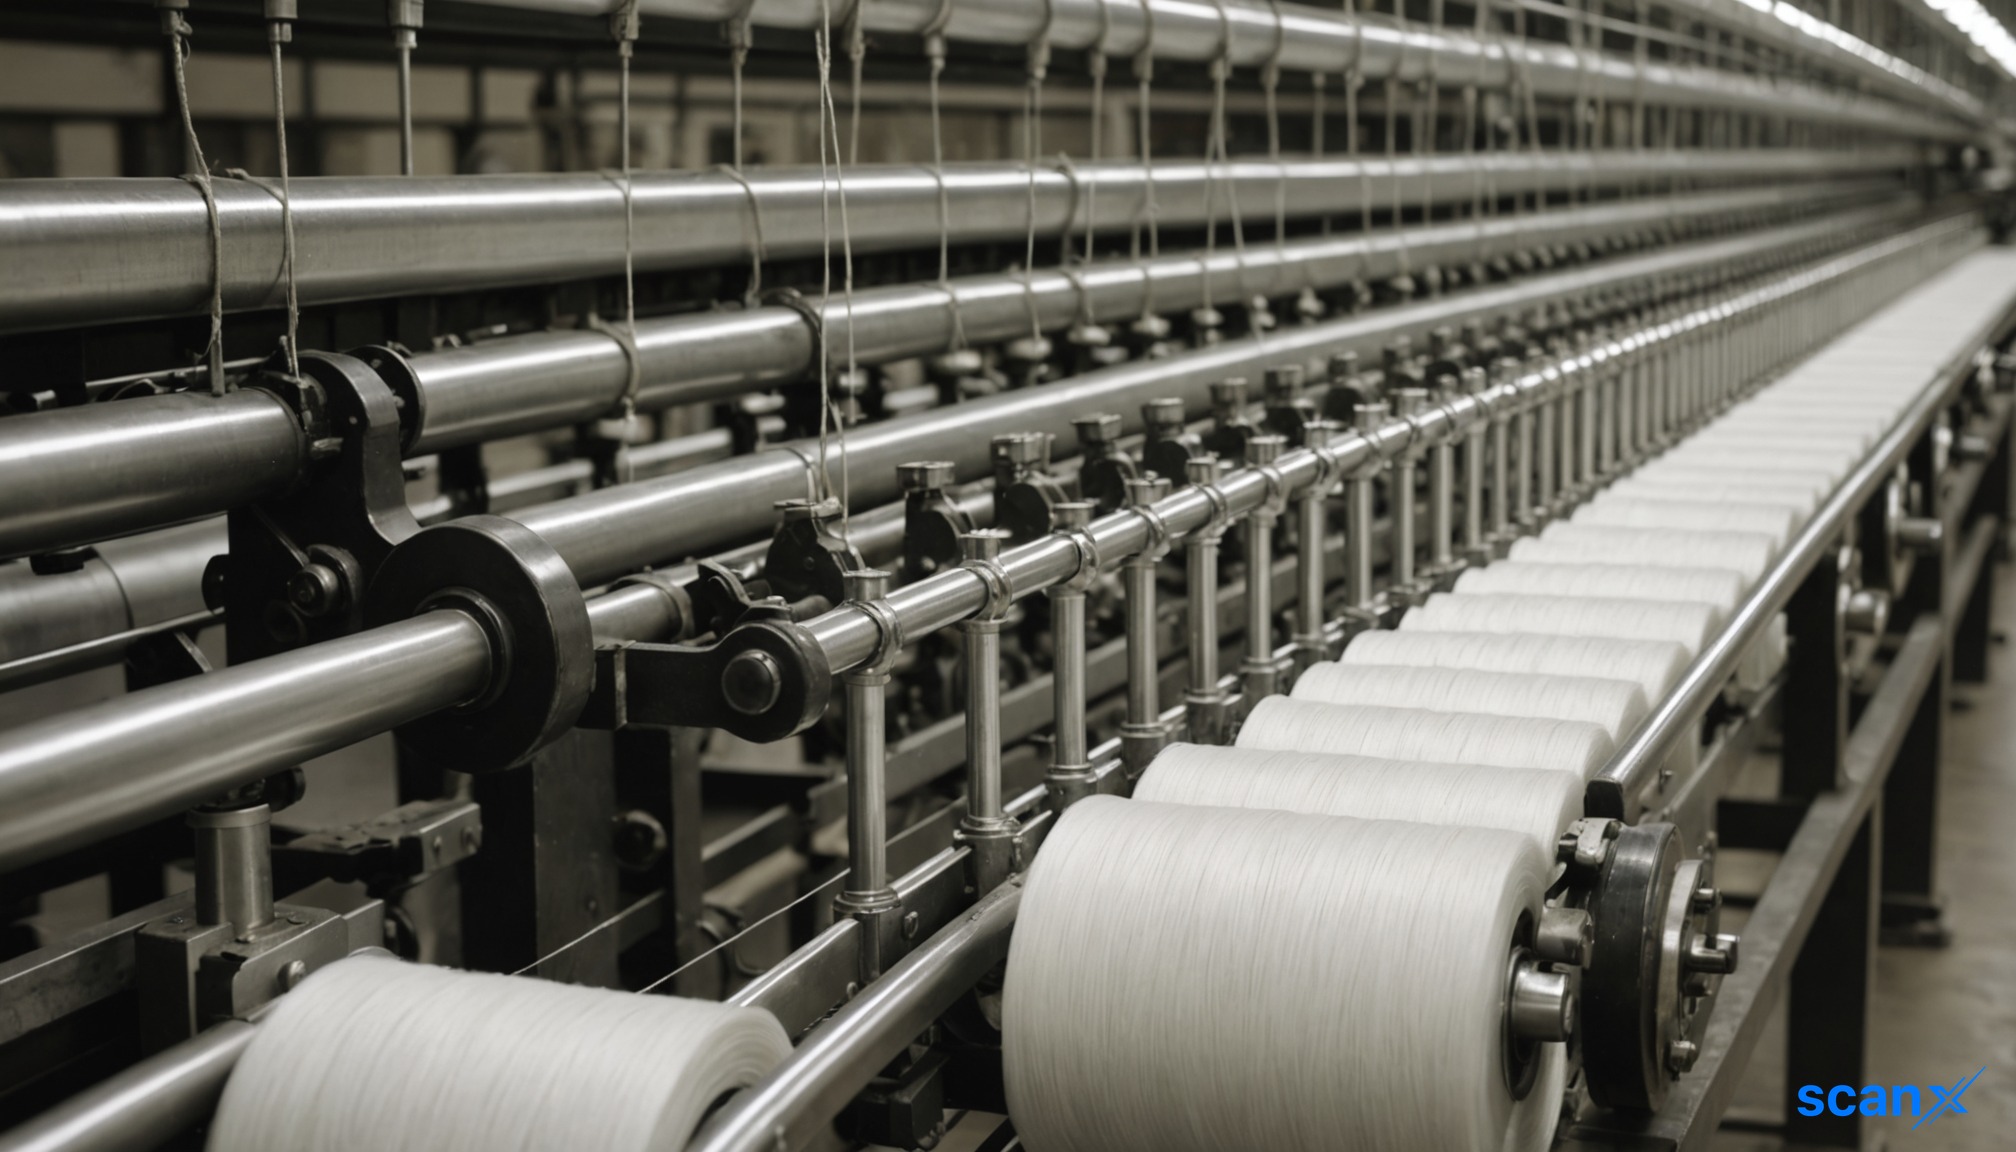
*this image is generated using AI for illustrative purposes only.
Mangalam Worldwide Limited has reported a robust financial performance for FY26, with Profit After Tax (PAT) increasing by 70% year-on-year to ₹50.14 crore, up from ₹29.53 crore in FY25. The fully integrated stainless steel manufacturer achieved a total income of ₹1,214.99 crore, a 14% rise from ₹1,066.03 crore in the previous fiscal year. EBITDA for the year stood at ₹97.84 crore, reflecting an improved margin of 8.05% compared to 5.63% in FY25. The Diluted EPS rose to ₹16.87 from ₹10.29 in the prior year.
Board Decisions and Corporate Actions
Following the board meeting on April 29, 2026, the directors approved the audited financial results for the quarter and year ended March 31, 2026. The board recommended a final dividend of ₹0.30 per equity share, representing 3% of the face value of ₹10 per share, subject to shareholder approval at the upcoming Annual General Meeting. Additionally, the board approved a proposal for the direct listing of the company's shares on the Main Board of BSE Limited, pending necessary approvals.
In key organizational changes, Mr. Chanakya Prakash Mangal's designation was changed from Managing Director to Director (Non-Executive Non Independent Director) effective April 29, 2026. The board also appointed new auditors for the fiscal year 2026-27. M/s. S S Rawat & Co. was appointed as the Internal Auditor, and M/s. V. M. Patel & Associates was appointed as the Cost Auditor.
| Board Decision: | Details |
|---|---|
| Final Dividend: | ₹0.30 per equity share (3% of face value) |
| BSE Listing Proposal: | Direct listing on Main Board approved |
| Leadership Change: | Chanakya Prakash Mangal redesignated as Director (Non-Executive Non Independent) |
| Internal Auditor: | M/s. S S Rawat & Co. (FRN: 147356W) |
| Cost Auditor: | M/s. V. M. Patel & Associates (Firm Reg No: 101519) |
FY26 and Q4 Financial Performance
The company's Q4 FY26 performance showed continued momentum, with total income reaching ₹266.51 crore. PAT for the quarter surged 81% year-on-year to ₹15.37 crore from ₹8.48 crore in Q4 FY25, while EBITDA for the quarter was recorded at ₹15.65 crore. The following tables summarise the key financial metrics:
| Performance Metric: | FY26 | FY25 | FY24 |
|---|---|---|---|
| Total Income (₹ Cr): | 1,214.99 | 1,066.03 | — |
| EBITDA (₹ Cr): | 97.84 | 60.05 | 20.92 |
| EBITDA Margin (%): | 8.05% | 5.63% | — |
| PAT (₹ Cr): | 50.14 | 29.53 | 17.58 |
| PAT Margin (%): | 4.13% | 2.77% | — |
| Diluted EPS (₹): | 16.87 | 10.29 | 8.45 |
| Q4 Performance: | Q4 FY26 | Q4 FY25 | Growth (%) |
|---|---|---|---|
| Total Income (₹ Cr): | 266.51 | 324.56 | — |
| EBITDA (₹ Cr): | 15.65 | — | — |
| PAT (₹ Cr): | 15.37 | 8.48 | +81% |
Strategic Milestones and Ratios
FY26 was a year of strategic milestones, including the migration to the NSE Main Board in September 2025 and a credit rating upgrade to "A". The company expanded its global footprint by securing vendor approvals from SABIC and QatarEnergy. On the sustainability front, a 1.2 MW rooftop solar system was installed at the Kapadvanj facility, with a 10.42 MW ground-mounted solar project under implementation at Handod, Vadodara.
Financial ratios indicate strengthened balance sheet health. Net worth grew to ₹305.48 crore in FY26 from ₹139.69 crore in FY23. Return on Equity (ROE) improved to 17.68%, while Return on Capital Employed (ROCE) rose to 15.35%. The Book Value per share increased to ₹100.91 from ₹86.17 in the previous year.
| Key Ratio: | FY26 | FY25 | FY24 |
|---|---|---|---|
| ROE (%): | 17.68 | 13.40 | — |
| ROCE (%): | 15.35 | 11.83 | 11.04 |
| Debt-to-Equity (Times): | 0.77 | 0.73 | 0.55 |
| Book Value (₹): | 100.91 | 86.17 | 69.38 |
Historical Stock Returns for Mangalam Worldwide
| 1 Day | 5 Days | 1 Month | 6 Months | 1 Year | 5 Years |
|---|---|---|---|---|---|
| -0.58% | -3.36% | +9.11% | +70.00% | +82.52% | +320.37% |

How might Mangalam Worldwide's vendor approvals from SABIC and QatarEnergy translate into long-term revenue contracts, and what share of total revenue could Middle East energy sector exports contribute in FY27?
With the 10.42 MW ground-mounted solar installation under implementation, what measurable impact on operating costs and EBITDA margins can investors expect once the project becomes fully operational?
How could the proposed direct listing on the BSE Main Board affect Mangalam Worldwide's stock liquidity, institutional investor participation, and valuation multiples compared to its current NSE Main Board positioning?
 19
19





 Access Market Heat-map & Insights
  Create, Save & Share your Screener
  Use 200+ Screening Filters





