

KPI Green Energy adds record 630+ MW capacity in Q2FY27


- KPI Green Energy energized a record 630+ MW DC capacity in Q2FY27
- The addition spans both IPP and EPC/CPP business verticals
- Q2FY27 additions exceed the cumulative 533 MW capacity as of Dec 2024
- Execution pace supports KP Group's 10 GW target by 2030

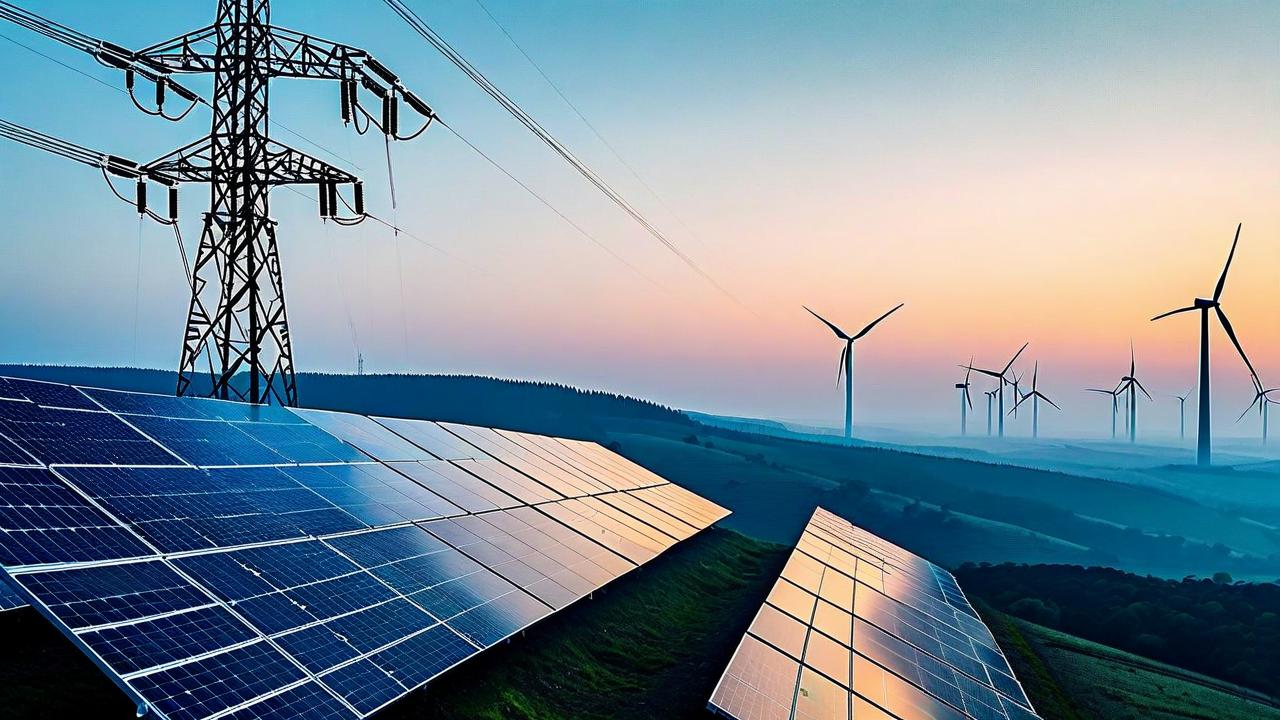

*this image is generated using AI for illustrative purposes only.
KPI Green Energy Limited announced the energization of 630+ MW DC capacity in the June-August quarter of FY27. This marks the highest single-quarter capacity addition in the company’s history.
The Gujarat-based renewable energy firm achieved this milestone across its Independent Power Producer (IPP) and Engineering, Procurement, and Construction (EPC/CPP) businesses. The company disclosed this development pursuant to Regulation 30 of the SEBI (Listing Obligations and Disclosure Requirements) Regulations, 2015.
Scale of Execution
The Q2FY27 energization figure exceeds the total capacity KPI Green Energy had added cumulatively over its first ~17 years of operation. As of December 2024, the company’s total energized capacity stood at 533 MW across both IPP and EPC segments.
| Metric | Value |
|---|---|
| Q2FY27 Capacity Energized | 630+ MW DC |
| Cumulative Capacity (Dec 2024) | 533 MW |
Dr. Faruk G. Patel, Chairman and Managing Director, stated that the pace of capacity addition reflects the execution capability built across both business verticals. He emphasized the company’s focus on scaling responsibly and strengthening its annuity income base.
Strategic Context
This quarter’s performance supports KP Group’s broader target of achieving over 10 GW of renewable capacity by 2030. The diversified mix of IPP assets and EPC projects underscores the scale and consistency of the company’s project execution engine.
What the Numbers Show
The magnitude of the Q2FY27 addition highlights a significant acceleration in execution velocity. Energizing more than 630 MW in three months compared to just 533 MW over nearly two decades indicates a structural shift in the company’s project delivery capacity rather than linear growth.
Historical Stock Returns for KPI Green Energy
| 1 Day | 5 Days | 1 Month | 6 Months | 1 Year | 5 Years |
|---|---|---|---|---|---|
| -0.64% | -1.07% | +15.39% | -26.40% | -28.77% | 0.0% |

How will this accelerated capacity addition impact KPI Green Energy's revenue mix and profitability margins between its IPP and EPC segments in the near term?
What specific financing strategies or partnerships is KPI Green Energy employing to fund the capital expenditure required to reach its 10 GW target by 2030?
How does this surge in execution velocity position KPI Green Energy against larger competitors in the Indian renewable energy market regarding project delivery reliability?
 18
18






 Create Custom Screeners
  Access 200+ Pre-built Filters
  Use 50+ Readymade Screener





