Instant Holdings raises FGP stake to 45.62% via open market buys

scanx
Reviewed by
Jubin VScanX News Team
Key Highlights
  • Instant Holdings and PACs increased FGP stake to 45.62%
  • Acquired 239,787 shares via open market purchases
  • Stake rose by 2.02% from previous 43.60% holding
  • Transactions occurred between May and August 2026
powered bylight_fuzz_icon
49370510

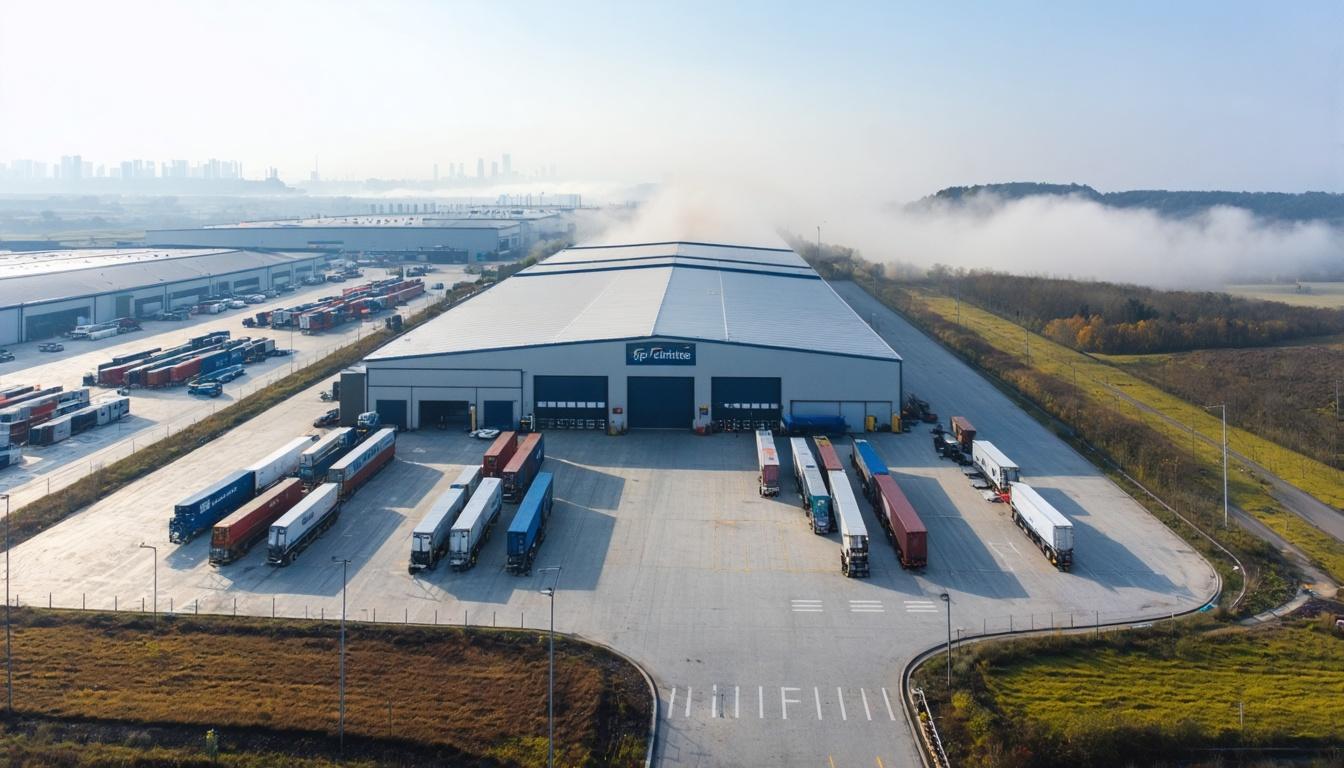
*this image is generated using AI for illustrative purposes only.

FGP Limited disclosed a substantial acquisition of shares by Instant Holdings Limited and its Persons Acting in Concert (PACs). The promoter group increased its holding to 45.62% of the total voting capital, up from 43.60% in the previous disclosure.

The acquisition involved the purchase of 239,787 equity shares through open market transactions on the BSE Limited between May 5, 2026, and August 26, 2026. This represents an increase of 2.02% in the promoter group's stake.

Acquisition Details

The filing under Regulation 29(2) of the SEBI (Substantial Acquisition of Shares and Takeovers) Regulations, 2011, lists Instant Holdings Limited along with nine other entities as PACs. These include Carnival Investment Limited, Swallow Associates LLP, Wonder Land LLP, Vayu Associates LLP, Chattarpati Apartments LLP, Nucleus Life Trust, Prism Estates Trust, RG Family Trust, Secura India Trust, and Mr. Harsh Vardhan Goenka.

Metric Before Acquisition Change After Acquisition
Shares Held 5,185,432 +239,787 5,425,219
Stake (% Voting Capital) 43.60% +2.02% 45.62%

Transaction Timeline

The bulk of the purchases occurred in late May and mid-June 2026, with additional buying activity recorded in August 2026. The largest single-day purchase was 30,654 shares on August 26, 2026, accounting for 0.26% of the total share capital.

  • May 2026: Multiple transactions totaling approximately 1 lakh shares.
  • June 2026: Continued accumulation with significant buys on June 18 (26,814 shares) and June 12 (7,548 shares).
  • August 2026: Final tranche including 15,728 shares on August 20 and 30,654 shares on August 26.

What the Numbers Show

The promoter group's stake now stands at 45.62%, leaving approximately 54.38% of the equity share capital in public hands. The total voting capital of FGP Limited remains unchanged at 11,895,051 shares of face value ₹10 each, amounting to ₹11,89,50,510. There is no dilution of share capital resulting from these transactions.

Historical Stock Returns for FGP

1 Day5 Days1 Month6 Months1 Year5 Years
-0.08%+16.56%+24.42%+35.16%+20.58%0.0%

Will the promoter group's increased stake to 45.62% trigger any mandatory open offer obligations under SEBI takeover regulations?

How might this consolidation of ownership impact the liquidity and trading volume of FGP Limited shares on the BSE?

Does this accumulation signal potential strategic changes, such as a delisting plan or a shift in corporate governance structure?

FGP Ltd publishes Q1FY27 results in newspapers per SEBI norms

scanx
Reviewed by
Shriram SScanX News Team
Key Highlights

FGP Limited disclosed its Q1FY27 financial results via newspaper publication on August 05, 2026, complying with SEBI Listing Regulations. The company reported a net profit of ₹24.37 lakh, down 11% from ₹27.32 lakh in Q1FY26, driven by operational shifts in its new commodity trading segment.

powered bylight_fuzz_icon
47400176

*this image is generated using AI for illustrative purposes only.

FGP Limited published its unaudited financial results for the quarter ended June 30, 2026 (Q1FY27) in The Free Press Journal and Navshakti on August 05, 2026. This publication fulfills the company’s obligation under Regulation 30 read with Regulation 47(3) of the SEBI (Listing Obligations and Disclosure Requirements) Regulations, 2015, ensuring transparency for shareholders and market participants. The results confirm a net profit of ₹24.37 lakh, marking an 11% year-over-year decline from ₹27.32 lakh but a significant turnaround from the ₹28.69 lakh loss recorded in the preceding quarter.

The Board of Directors approved the unaudited financial results at a meeting held on August 04, 2026. The results were reviewed by MVK Associates, the statutory auditors, who issued an unmodified conclusion pursuant to Regulation 33 of the SEBI (Listing Obligations and Disclosure Requirements) Regulations, 2015. The review was conducted in accordance with Standard on Review Engagement (SRE) 2410. Shalu Sarraf, Company Secretary & Compliance Officer, signed the disclosure letter to BSE Limited.

Financial Performance

Revenue from operations stood at ₹52.88 lakh in Q1FY27, compared to ₹6.54 lakh in Q1FY26. Other income contributed significantly to the bottom line, totaling ₹38.40 lakh, which is nearly identical to the ₹38.38 lakh recorded in the same quarter last year. Total expenses were contained at ₹61.56 lakh, down sharply from ₹208.09 lakh in the previous quarter, where inventory changes had inflated costs.

Metric Q1FY27 (₹ Lakh) Q4FY26 (₹ Lakh) Q1FY26 (₹ Lakh)
Revenue from Operations 52.88 173.37 6.54
Other Income 38.40 1.30 38.38
Total Expenses 61.56 208.09 12.56
Profit Before Tax 29.72 (33.42) 32.36
Net Profit 24.37 (28.69) 27.32
EPS (Basic) ₹0.20 (₹0.24) ₹0.23

Segment Analysis

The company commenced commodity trading operations in October 2025, leading to the identification of two reportable segments: Business Centre and Commodity Trading. In Q1FY27, the Commodity Trading segment generated ₹46.34 lakh in revenue, while the Business Centre contributed ₹6.54 lakh. The Business Centre remained the more profitable unit, reporting segment results of ₹3.86 lakh compared to ₹0.29 lakh from Commodity Trading.

What the Numbers Show

A critical observation is the reliance on 'Other Unallocable Income' for overall profitability. While the combined segment results amounted to only ₹4.15 lakh, the company reported a profit before tax of ₹29.72 lakh. This indicates that ₹25.57 lakh of pre-tax profit was derived from unallocable items, likely interest or investment income, rather than core operating segments. Investors should monitor whether this high level of non-operating income is sustainable or if it masks thinner margins in the new trading venture.

Historical Stock Returns for FGP

1 Day5 Days1 Month6 Months1 Year5 Years
-0.08%+16.56%+24.42%+35.16%+20.58%0.0%

How sustainable is the company's reliance on 'Other Unallocable Income' given that it constitutes the majority of pre-tax profits, and what risks does this pose if interest rates or investment returns decline?

What is the management's strategy to improve the operational margins of the Commodity Trading segment, which generated significant revenue but minimal profit compared to the Business Centre?

Given the sharp quarter-over-quarter drop in revenue from operations, what specific market factors or strategic shifts contributed to this contraction, and is a recovery expected in Q2FY27?

More News on FGP

1 Year Returns:+20.58%