

Fairchem Organics net profit surges 751% in Q1FY27 on margin expansion


Fairchem Organics delivered exceptional Q1FY27 results with net profit jumping 751% to ₹100 crore, supported by robust revenue growth of 34.4% to ₹1,761 crore. The company’s EBITDA margin expanded significantly to 10.16%, reflecting improved price realization and reduced competitive pressure from imports.



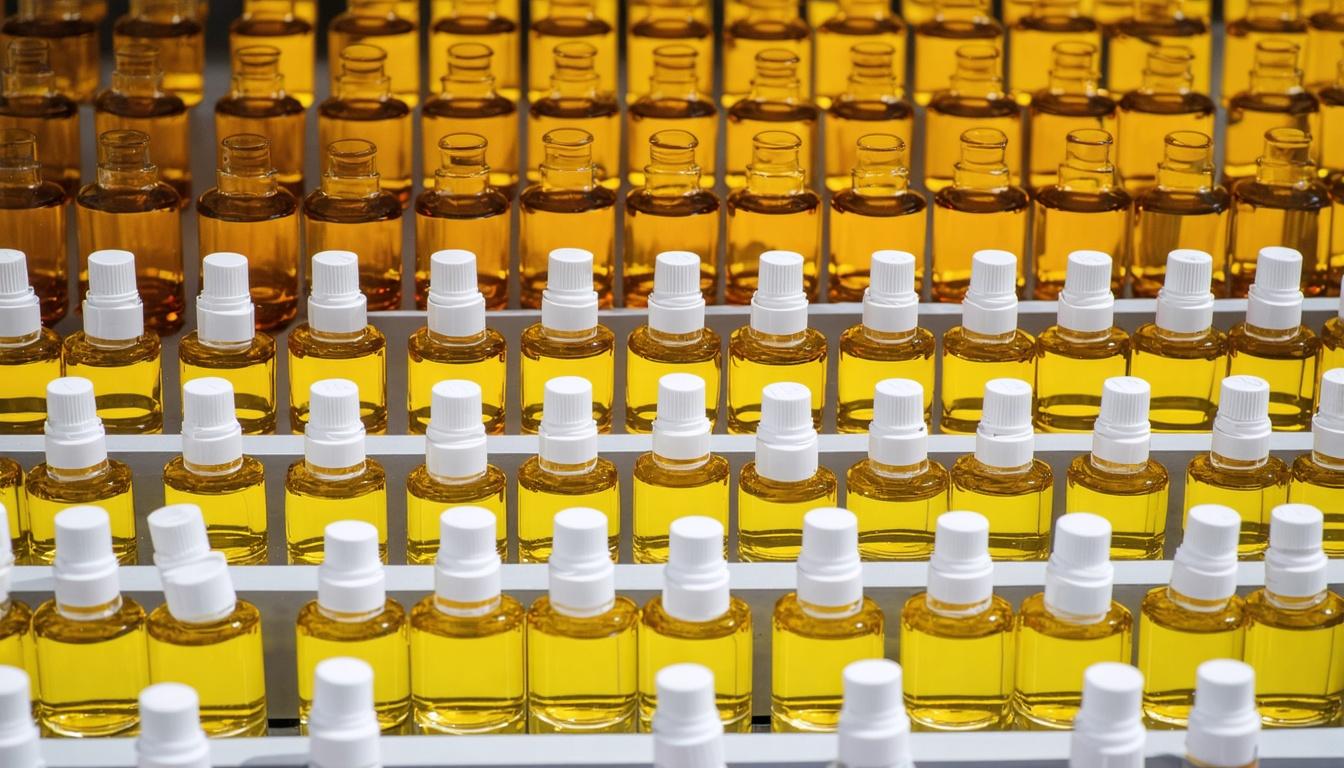
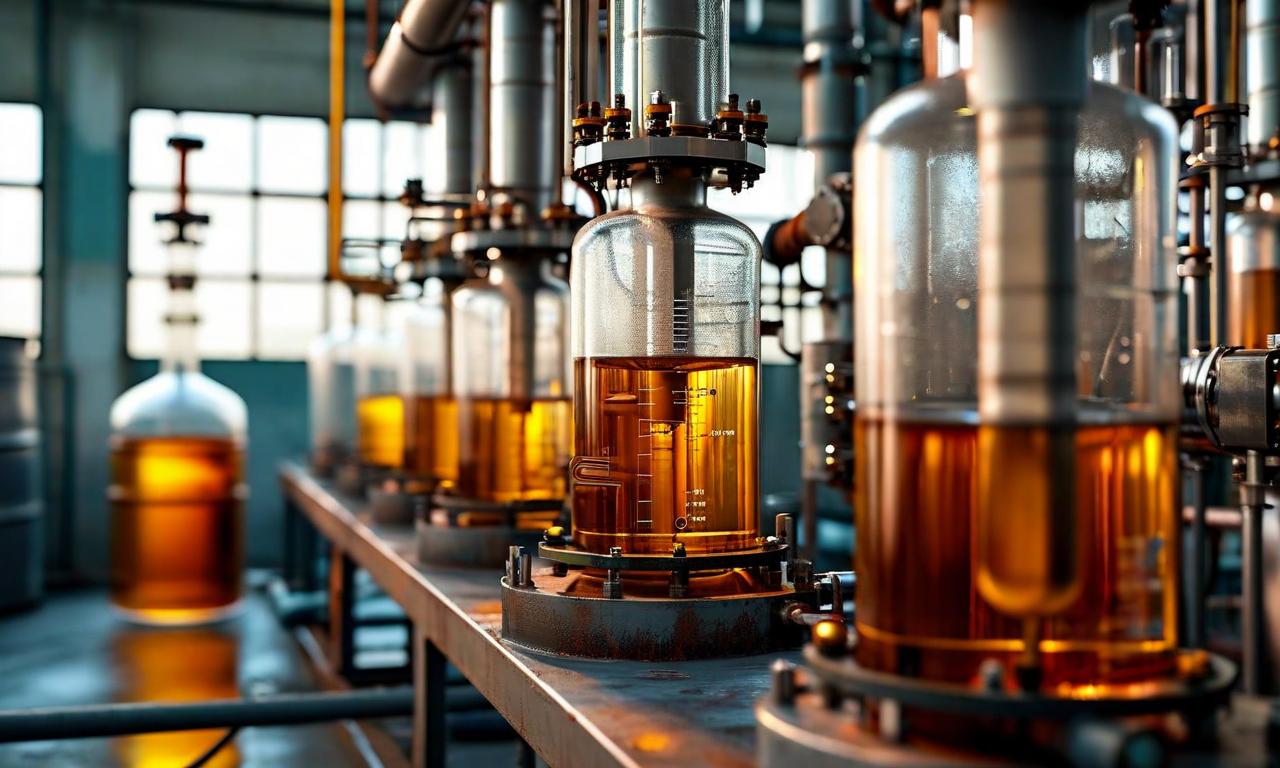
*this image is generated using AI for illustrative purposes only.
Fairchem Organics reported a net profit of ₹100 crore for the quarter ended June 30, 2026, marking a 751% year-on-year increase from ₹12 crore in the corresponding period of the previous fiscal. The specialty chemicals manufacturer achieved this turnaround primarily through improved price realization in the domestic market, supported by lower import competition due to supply chain constraints. Revenue from operations climbed 34.4% to ₹1,761 crore, while EBITDA nearly tripled to ₹179 crore, signaling strong operational momentum in the first quarter of FY27.
The Board of Directors approved the unaudited financial results on July 27, 2026, pursuant to Regulation 30 read with Schedule III Part A of the SEBI (Listing Obligations and Disclosure Requirements) Regulations, 2015. The results were prepared in accordance with Ind AS and reviewed by the Audit Committee before board approval. Statutory Auditors KPMG expressed an unmodified review conclusion on the limited review of the financial statements, having audited the company for the last nine years.
Financial Performance Highlights
The company's total income reached ₹1,764 crore in Q1FY27, up from ₹1,312 crore in Q1FY26. This growth was fueled by higher revenue from operations, which stood at ₹1,761 crore against ₹1,311 crore in the prior year period. Other income contributed marginally at ₹3 crore. The following table summarises the key financial metrics for the quarter:
| Particulars: | Q1FY27 | Q1FY26 | YoY Change |
|---|---|---|---|
| Revenue from Operations: | ₹1,761 crore | ₹1,311 crore | +34.4% |
| Total Income: | ₹1,764 crore | ₹1,312 crore | +34.5% |
| EBITDA: | ₹179 crore | ₹52 crore | +242.1% |
| EBITDA Margin: | 10.16% | 3.97% | +619 bps |
| Profit Before Tax: | ₹136 crore | ₹16 crore | +744.1% |
| Net Profit After Tax: | ₹100 crore | ₹12 crore | +753.3% |
| EPS (Basic/Diluted): | ₹7.95 | ₹0.90* | +783.3% |
*Note: EPS figures derived from reported PAT and equity shares outstanding; previous year EPS adjusted for comparability.
Cost of materials consumed rose to reflect increased production volumes, while finance costs nearly doubled to ₹18 crore from ₹10 crore. Despite these cost increases, the company managed to expand its pre-tax profit significantly to ₹136 crore from ₹16 crore in the prior year period. Total expenses grew at a slower pace of 25.8% compared to revenue growth of 34.4%, demonstrating operating leverage.
Strategic Outlook and Market Position
Operating in a single reportable segment of specialty chemicals, including oleo chemicals and intermediate nutraceuticals, Fairchem Organics generated segment revenue of ₹1,761 crore. Segment assets grew to ₹397.52 crore as of June 30, 2026, from ₹361.90 crore a year earlier. The company maintains a competitive advantage through its "waste-to-wealth" manufacturing model, processing by-products like Acid Oil and Deodorizer Distillate from vegetable oil refineries into high-value chemicals such as Isostearic Acid and Dimer Acid.
Management highlighted four key strategies for future growth: cost optimization through energy audits and domestic catalyst substitution, product upgradation including low-titre Linoleic Acid, new product development such as bypass fat from PFAD, and geographical diversification. With level-playing tariffs in the US and proposed Free Trade Agreements with the EU and UK, the company aims to increase exports initially by 25% and eventually to 50% of sales.
What the Numbers Show
The dramatic turnaround in profitability is evident across multiple metrics. While revenue growth of 34% is substantial, the EBITDA margin expansion from 3.97% to 10.16% highlights a meaningful improvement in operating efficiency. The 744% surge in pre-tax profit further indicates significant operating leverage, as the company successfully converted top-line growth into bottom-line gains despite rising material and finance costs. This performance underscores the resilience of the specialty chemicals business model during this period, leveraging its position as one of the lowest-cost producers globally due to secure, low-cost raw material supply chains.
Historical Stock Returns for Fairchem Organics
| 1 Day | 5 Days | 1 Month | 6 Months | 1 Year | 5 Years |
|---|---|---|---|---|---|
| -2.18% | +0.26% | +21.22% | +33.19% | -1.94% | 0.0% |

How sustainable is the current EBITDA margin expansion if global supply chain constraints ease and import competition intensifies in Q2FY27?
What specific operational hurdles might delay Fairchem Organics' target of increasing exports to 50% of total sales despite favorable US tariffs and proposed FTAs?
Could the near-doubling of finance costs signal an aggressive expansion strategy that may pressure future cash flows or increase leverage ratios?
 20
20





 Create Custom Screeners
  Access 200+ Pre-built Filters
  Use 50+ Readymade Screener





