

Eris Lifesciences Q1 FY27 profit up 14.5%; earnings call recording available


Eris Lifesciences delivered a 14.5% increase in Q1 FY27 net profit to ₹143 crore, supported by strong domestic branded formulations growth. However, EBITDA margins fell to 33.9%, missing the full-year guidance target as Swiss Parenterals faced ongoing compliance costs.

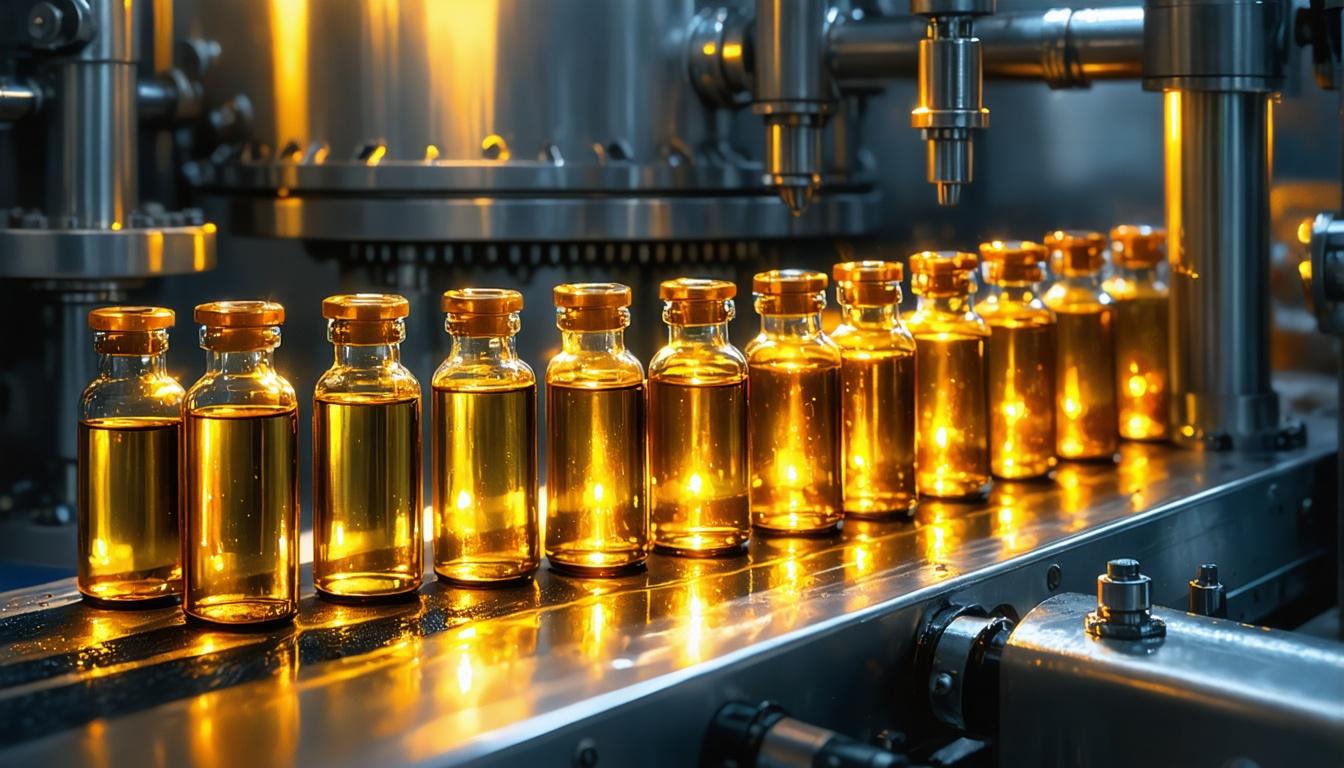

*this image is generated using AI for illustrative purposes only.
Eris Lifesciences Limited reported a consolidated net profit of ₹143 crore for the quarter ended June 30, 2026 (Q1 FY27), marking a 14.5% year-on-year increase from ₹125 crore in Q1 FY26. Revenue from operations rose 13% to ₹873 crore, driven primarily by its Domestic Branded Formulations (DBF) segment, which recorded organic revenue growth of 14.2%. However, the company's EBITDA margin came in at 33.9% for the quarter, falling short of its FY27 full-year guidance of 36-37%. The Board of Directors approved the unaudited financial results on July 29, 2026, pursuant to Regulation 30 of the SEBI (Listing Obligations and Disclosure Requirements) Regulations, 2015. Following the approval, the company made the recording of the earnings conference call available on its website.
Consolidated Financial Performance
Consolidated revenue from operations stood at ₹873 crore in Q1 FY27, compared to ₹773 crore in the corresponding period last year. EBITDA grew by 7% to ₹296 crore, though the EBITDA margin contracted to 33.9% from 35.8% in Q1 FY26, reflecting rising operating costs relative to revenue — and remaining meaningfully below the company's stated FY27 guidance band of 36-37%. Profit after tax (PAT) reached ₹143 crore, with an effective tax rate of 20%, down from 22.5% in the previous year. Operating cash flow remained robust at 77% of EBITDA.
| Metric: | Q1 FY27 | Q1 FY26 | Change (YoY) |
|---|---|---|---|
| Revenue from Operations: | ₹873 crore | ₹773 crore | +13.0% |
| EBITDA: | ₹296 crore | ₹277 crore | +7.1% |
| EBITDA Margin: | 33.9% | 35.8% | Contraction |
| Net Profit (PAT): | ₹143 crore | ₹125 crore | +14.5% |
| FY27 EBITDA Margin Guidance: | 36-37% | — | Below Guidance |
Segment Highlights: DBF and International Business
The DBF segment contributed significantly to top-line growth, with revenue rising to ₹801 crore from ₹702 crore in Q1 FY26. Seven out of ten therapy categories in the portfolio recorded double-digit growth. The Insulin segment grew by 27.7% to ₹412 crore, driven by market share gains in Rapid-Acting Human Insulin (RHI) and Glargine, where Eris' share increased from 9% to 16% since the Biocon acquisition. The GLP-1 segment surged by 165.5%, with the brand Sundae securing the #1 rank in prescriptions (21% share) and units (20% share) in the generic semaglutide market.
In contrast, the Swiss Parenterals business saw revenue increase by 5% to ₹72 crore from ₹68 crore, but EBITDA declined by 19% to ₹18 crore from ₹22 crore due to ongoing Corrective and Preventive Actions (CAPA) at European Union sites. Management indicated that while margin contraction may persist in FY27, clarity is expected post-Q2 FY27 as sites aim to be audit-ready by December 2026.
Strategic Priorities and Shareholding
Management outlined key priorities for the next two quarters, including driving the Oral Anti-Diabetics (OAD) segment to 70% of market growth, commercializing Eris Bionxt for supply control, and entering the non-represented Insulin Analogs market valued at ₹2,309 crore. Promoter holding remained stable at 54.14% as of June 2026, with Domestic Institutional Investors (DIIs) holding 20.71% and Foreign Portfolio Investors (FPIs) at 14.39%.
What the Numbers Show
The gap between the Q1 FY27 EBITDA margin of 33.9% and the company's FY27 guidance of 36-37% highlights the near-term pressure from rising operating costs and the ongoing CAPA-related drag from Swiss Parenterals. Despite this, robust cash conversion at 77% of EBITDA and strong growth in high-margin segments such as GLP-1 and Insulin underscore the underlying operational strength. The aggressive expansion into high-growth niches like GLP-1 and Insulin Analogs positions the company to potentially offset margin pressures from legacy segments in the medium term.
Historical Stock Returns for Eris Lifesciences
| 1 Day | 5 Days | 1 Month | 6 Months | 1 Year | 5 Years |
|---|---|---|---|---|---|
| -0.07% | +0.26% | -15.25% | -17.36% | -28.17% | +40.37% |

How significant will the margin drag from Swiss Parenterals' CAPA initiatives be in Q2 FY27, and what specific operational milestones must be met by December 2026 to restore audit readiness?
Can the rapid growth in the GLP-1 segment (Sundae) and Insulin market share gains sufficiently offset the EBITDA margin contraction to help meet the full-year guidance of 36-37%?
What is the projected timeline and capital expenditure required for Eris Bionxt to achieve full commercial scale and effectively manage supply chain control?
 17
17






 Create Custom Screeners
  Access 200+ Pre-built Filters
  Use 50+ Readymade Screener





