

Cheniere Energy Q2FY26 Results: Adjusted EBITDA hits $1.8 billion, guidance raised


- Adjusted EBITDA reached $1.8 billion in Q2 FY26, with net income exceeding $3 billion
- Full-year 2026 guidance raised to $7.9-$8.4 billion in adjusted EBITDA and $5.3-$5.8 billion in DCF
- LNG production rose 20% YoY to 184 cargoes, driven by Stage 3 train completions
- Company signed a $4.7 billion EPC contract with Bechtel for Sabine Pass Expansion Phase One
- Shareholder returns included $550 million in share repurchases and a 55.5 cent dividend declaration

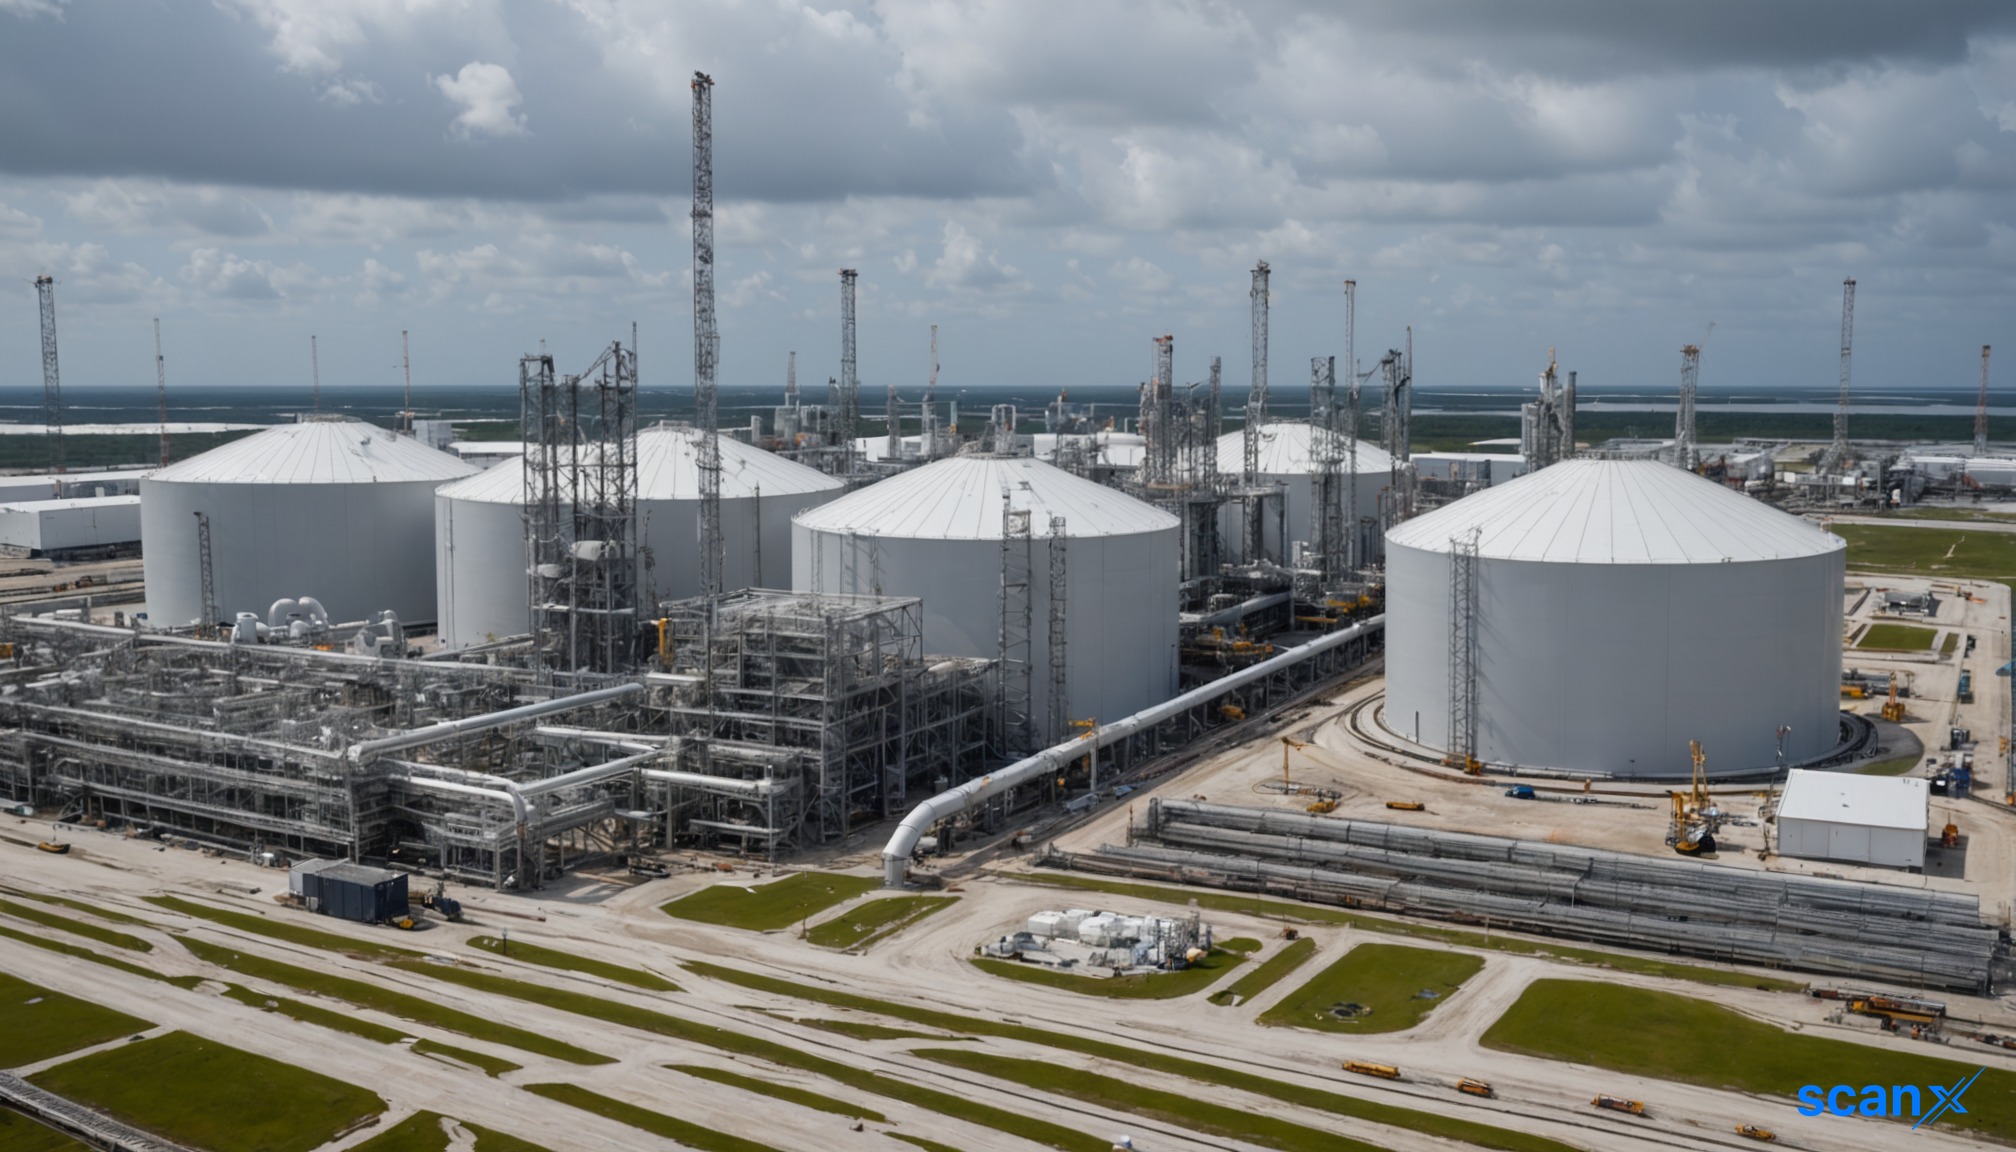

*this image is generated using AI for illustrative purposes only.
Cheniere Energy Inc reported consolidated adjusted EBITDA of $1.8 billion for the second quarter of fiscal year 2026, alongside distributable cash flow of $1.2 billion. Net income exceeded $3 billion, reflecting strong operational performance and favorable market conditions.
The company revised its full-year 2026 financial guidance upwards, now projecting consolidated adjusted EBITDA between $7.9 billion and $8.4 billion, and distributable cash flow between $5.3 billion and $5.8 billion. This marks the second consecutive quarter of upward guidance revisions, with the new low-end estimates exceeding previous high-end forecasts for both metrics.
Operational Highlights and Production Growth
Production volumes surged during the quarter, with Cheniere producing and exporting 184 LNG cargoes, equivalent to 672 TBTU. This represents a 20% increase year-over-year, driven by the completion and accelerated startup of additional trains at Corpus Christi Stage 3. Substantial completion of Train 6 was achieved in June, while commissioning on Train 7 has commenced, with first LNG expected imminently.
The company also advanced its Sabine Pass Expansion Project Phase One, signing a lump sum turnkey engineering, procurement, and construction contract with Bechtel Energy valued at approximately $4.7 billion. This brownfield project aims to add over 6 million tons per annum of production capacity, representing total growth of approximately 10% to the existing platform.
Financial Performance and Capital Allocation
The upward revision in full-year guidance is primarily attributed to an improved production forecast, sustained higher marketing margins, and contributions from optimization activities. The midpoint of the production forecast increased from 52-54 million tons to 53-54 million tons.
| Metric | Q2 FY26 | Guidance Change (Midpoint) |
|---|---|---|
| Adjusted EBITDA | $1.8 billion | +$650 million |
| Distributable Cash Flow | $1.2 billion | +$550 million |
| Full-Year EBITDA Range | N/A | $7.9-$8.4 billion |
| Full-Year DCF Range | N/A | $5.3-$5.8 billion |
During the quarter, Cheniere deployed nearly $900 million of equity cash flow toward capital allocation pillars, including accretive growth, shareholder returns, and balance sheet management. The company repurchased approximately 2.2 million shares for $550 million and declared a dividend of 55.5 cents per common share. Total buybacks in the first half of the year reached approximately $1.1 billion.
Market Dynamics and Strategic Positioning
Global LNG markets experienced elevated volatility in Q2 due to geopolitical tensions and constraints on supply through the Strait of Hormuz. Despite these disruptions, U.S. exports to Asia reached a quarterly record of approximately 11 million tons, as flexible destination contracts allowed Atlantic Basin supply to respond to shifting market signals. Europe entered the summer with storage levels materially below last year and the five-year average, ending the quarter with an approximately 11 BCM storage deficit.
Management emphasized that the current environment reinforces the strategic importance of energy security and reliable supply. Cheniere’s highly contracted, returns-focused business model continues to provide stability, with long-term contracts securing cash flow visibility even amid volatile spot prices.
What the Numbers Show
A notable divergence exists between the substantial rise in net income and the operational drivers of adjusted EBITDA. While net income exceeded $3 billion, up nearly $1.5 billion from Q2 2025, management clarified that this increase was driven primarily by non-cash derivative impacts related to long-term IPM agreements. By designating the normal purchases and normal sales accounting exception for approximately 75% of IPM volumes, future quarters will see reduced variability in net income, better aligning reported earnings with the stable cash flow profile of the infrastructure platform.

How will the commissioning of Train 7 and the subsequent Bechtel expansion project impact Cheniere's ability to meet rising long-term contract commitments without compromising spot market flexibility?
Given the 11 BCM storage deficit in Europe, how might sustained low inventory levels through the winter influence the premium pricing structure for U.S. LNG cargoes in the upcoming quarters?
With the accounting change reducing net income variability by designating normal purchases and sales exceptions, how will this shift alter analyst valuation models and investor perception of earnings quality?







 Access Market Heat-map & Insights
  Create, Save & Share your Screener
  Use 200+ Screening Filters





