

Cheniere Energy Q2 sales beat estimates, adjusted EPS misses


Cheniere Energy delivered mixed Q2 results with sales of $5.732 billion beating the $4.895 billion estimate by 17.10%, while adjusted EPS of $3.02 missed the $3.04 forecast.

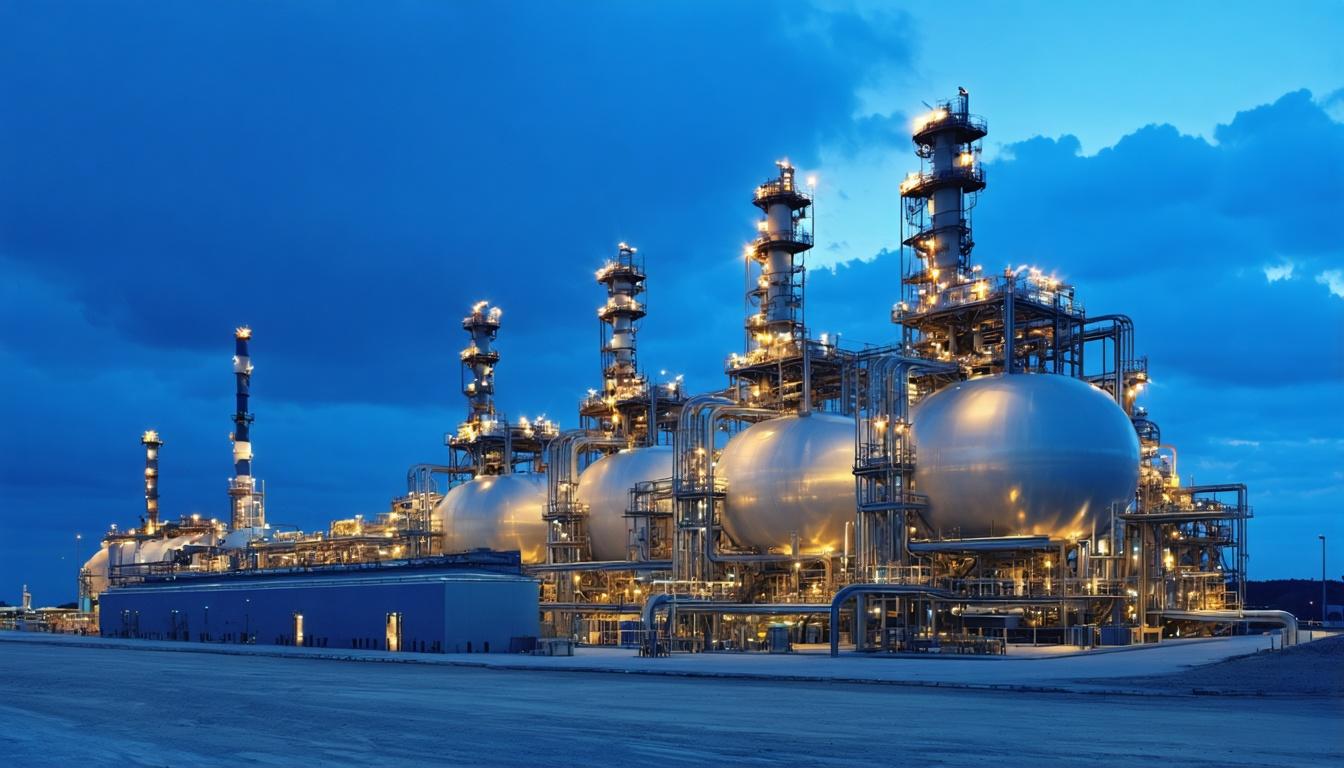

*this image is generated using AI for illustrative purposes only.
Cheniere Energy reported mixed second-quarter results, with sales significantly beating analyst expectations while adjusted earnings per share fell short of consensus forecasts. The company generated quarterly revenue of $5.732 billion, surpassing the estimated $4.895 billion by 17.10 percent. However, adjusted earnings per share came in at $3.02, missing the analyst estimate of $3.04 by 0.66 percent.
The divergence between top-line and bottom-line performance highlights a quarter where strong revenue generation was not fully translated into expected profitability metrics. While the substantial revenue beat suggests robust demand or favorable pricing dynamics in the liquefied natural gas sector, the EPS miss indicates margin pressures or higher-than-anticipated costs impacting net income.
Financial Performance
The company’s financial results present a split picture against market expectations. Revenue performance was a clear outlier on the positive side, whereas profitability metrics narrowly missed targets.
| Metric | Reported | Estimate | Variance |
|---|---|---|---|
| Sales | $5.732 billion | $4.895 billion | +17.10% |
| Adj. EPS | $3.02 | $3.04 | -0.66% |
What the Numbers Show
The 17.10 percent revenue beat indicates that Cheniere Energy’s actual commercial performance was significantly stronger than the baseline assumptions used by analysts. This surplus provides a positive signal regarding the company’s top-line momentum relative to market forecasts. Conversely, the adjusted EPS miss of $0.02 per share suggests that operational efficiencies or cost controls did not keep pace with the revenue growth, or that one-time items impacted the bottom line. Investors should note that while the top line exceeded expectations by a wide margin, the bottom line remained slightly below consensus, reflecting the complex cost structure inherent in LNG production and distribution.

What specific cost drivers or operational inefficiencies prevented Cheniere from converting its significant revenue beat into higher-than-expected earnings per share?
How might the divergence between strong top-line growth and margin compression impact Cheniere's valuation multiples relative to other LNG producers in the coming quarters?
Will Cheniere adjust its full-year guidance to reflect the sustainability of current LNG pricing dynamics and demand levels observed in Q2?
 17
17









 Create Custom Screeners
  Access 200+ Pre-built Filters
  Use 50+ Readymade Screener





