

Chemcon Speciality Chemicals Q1FY27 profit surges 72% on margin gains


Chemcon Speciality Chemicals delivered a strong Q1FY27 performance with net profit surging 72% to ₹10.96 crore and revenue rising 24.2% to ₹66.49 crore. EBITDA margins expanded significantly to 23.31% due to improved realizations and operational efficiency in its organic and inorganic chemical segments.

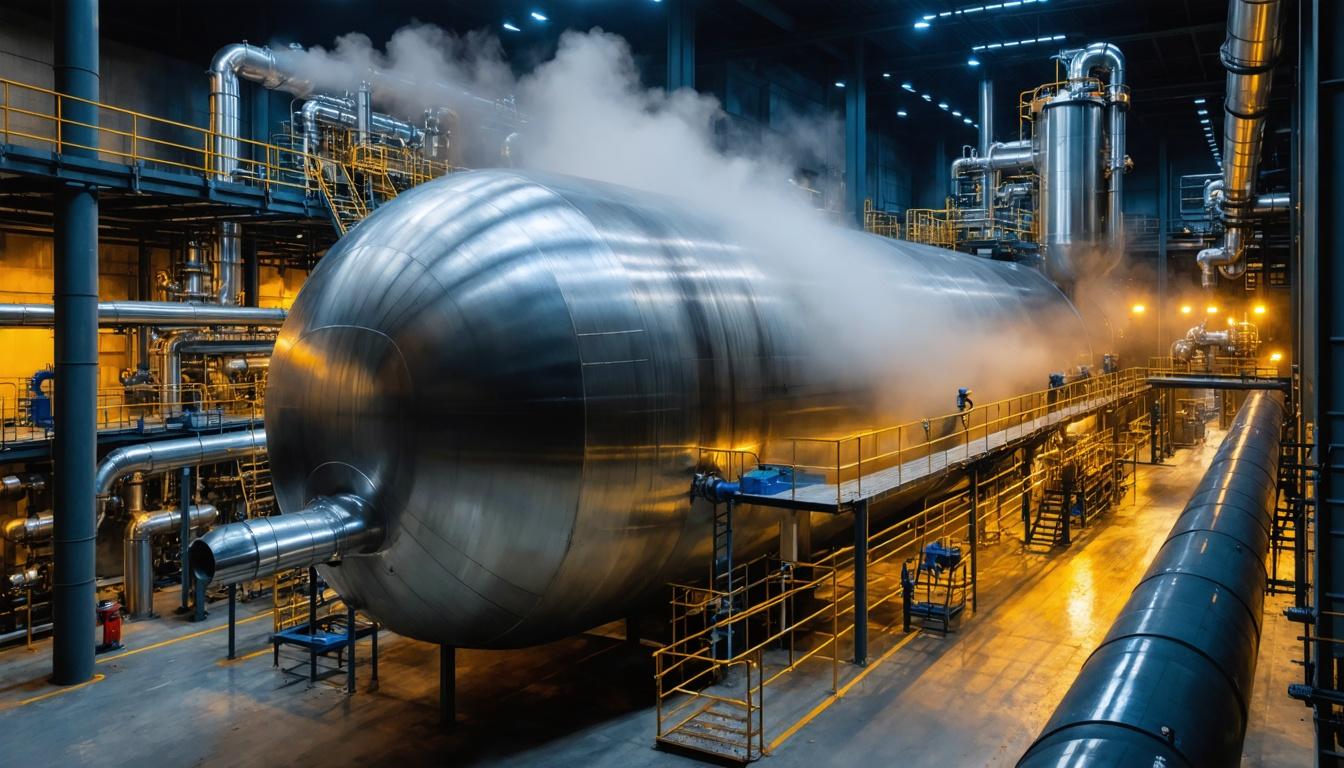

*this image is generated using AI for illustrative purposes only.
Chemcon Speciality Chemicals reported a 72% year-on-year rise in net profit to ₹10.96 crore for the quarter ended June 30, 2026 (Q1FY27), driven by improved realizations across its product portfolio and a sharp expansion in operating margins. Revenue from operations grew 24.2% to ₹66.49 crore, while EBITDA more than doubled to ₹15.40 crore, pushing the EBITDA margin to 23.31% from 14.52% in the corresponding period of FY26. The performance underscores robust demand in the specialty chemicals segment, particularly in organic chemicals, despite persistent pricing pressure from global competition.
The Board of Directors approved the unaudited financial results at a meeting held on August 3, 2026. The results were reviewed by statutory auditors Shah Mehta & Bakshi pursuant to Regulation 33 of the SEBI (Listing Obligations and Disclosure Requirements) Regulations, 2015. In an accompanying investor presentation released on August 4, 2026, management attributed the strong start to FY27 to better absorption of fixed costs and favorable market conditions in key product categories such as HMDS, CMIC, Bromobenzene, and 2-Bromo.
Financial Performance
Revenue growth was supported by higher volumes and improved pricing, although total sales volume declined slightly to 2,066 MT from 2,098 MT in Q1FY26, reflecting a shift towards higher-value products. The Organic Chemicals segment contributed 75% of revenue, up from 79% in Q1FY26 but down from 71% in Q4FY26. Other income remained stable at ₹3.72 crore. Total expenses rose 14.0% to ₹55.66 crore, primarily due to higher material costs which increased to ₹42.27 crore from ₹28.80 crore. Despite this, profit before tax expanded to ₹14.55 crore from ₹8.43 crore.
| Particulars: | Q1FY27 (₹ Lakhs) | Q1FY26 (₹ Lakhs) | YoY Change |
|---|---|---|---|
| Revenue From Operations | 6,648.68 | 5,351.80 | +24.2% |
| Total Income | 7,021.06 | 5,723.49 | +22.7% |
| Total Expenses | 5,565.88 | 4,880.46 | +14.0% |
| EBITDA | 1,540.00 | 780.00 | +97.4% |
| EBITDA Margin | 23.31% | 14.52% | +879 bps |
| Profit Before Tax | 1,455.18 | 843.03 | +72.6% |
| Net Profit | 1,096.29 | 638.71 | +71.6% |
Earnings per share (basic) rose to ₹2.99 from ₹1.74. For the full year FY26, the company reported a net profit of ₹23.60 crore on revenue of ₹240.00 crore.
Segment and Operational Insights
The Organic Chemicals business witnessed notable improvement, driven by HMDS, where Chemcon is the only manufacturer in India and the third-largest globally. The Inorganic Chemicals segment, comprising bromides like Calcium Bromide and Zinc Bromide, also recorded stable performance aided by improved demand. Geographically, domestic sales accounted for 69% of revenue in Q1FY27, compared to 70% in Q1FY26, while exports stood at 31%. The company maintains two manufacturing facilities in Vadodara, Gujarat, with an installed capacity of 11,400 MTPA for organic chemicals and 15,000 MTPA for inorganic chemicals.
What the Numbers Show
A key analytical observation is the significant operating leverage demonstrated in Q1FY27. While revenue grew by 24.2%, total expenses increased by only 14.0%, leading to an EBITDA margin expansion of approximately 879 basis points. This divergence suggests that the company successfully passed on material cost increases to customers or optimized its product mix towards higher-margin items. The stability in other income and moderate increase in employee benefits further indicate that the profit expansion was primarily operational, stemming from improved realizations and efficiency gains rather than one-off gains.
Compliance and Disclosures
The financial results have been prepared in accordance with Indian Accounting Standards (Ind AS) prescribed under Section 133 of the Companies Act, 2013. The company operates in a single reportable segment as per Ind AS 108 - Operating Segments. It confirmed that it has no subsidiary, associate, or joint venture company as of June 30, 2026. The investor presentation was filed pursuant to Regulation 30 of the SEBI LODR Regulations, 2015.
Historical Stock Returns for Chemcon Speciality Chemicals
| 1 Day | 5 Days | 1 Month | 6 Months | 1 Year | 5 Years |
|---|---|---|---|---|---|
| -0.62% | -5.57% | +8.21% | +71.48% | -19.69% | -50.58% |

Can Chemcon sustain the 23.31% EBITDA margin expansion in Q2FY27, or is this largely a one-time benefit from fixed cost absorption?
How will Chemcon mitigate the risk of global pricing pressure on key products like HMDS and Bromobenzene in the coming quarters?
With total sales volume declining slightly despite revenue growth, what specific strategies will the company employ to reverse the volume trend without compromising margins?
 16
16









 Access 50+ Readymade Screeners
  Use 200+ Custom Filters
  Get Full Market Insights





