

Baroda Extrusion wins Rs 27.83 crore order for copper alloy products


- Baroda Extrusion wins Rs 27.83 crore confirmed order for copper alloy products.
- TTM revenue is reported as Rs 0.0 Cr, making this order the sole visible driver for future revenue recovery.
- No prior order disclosures found in the last 3 quarters, limiting historical inflow comparison.
- FY26 profit growth was -62.8%, highlighting the need for margin stabilization upon execution.

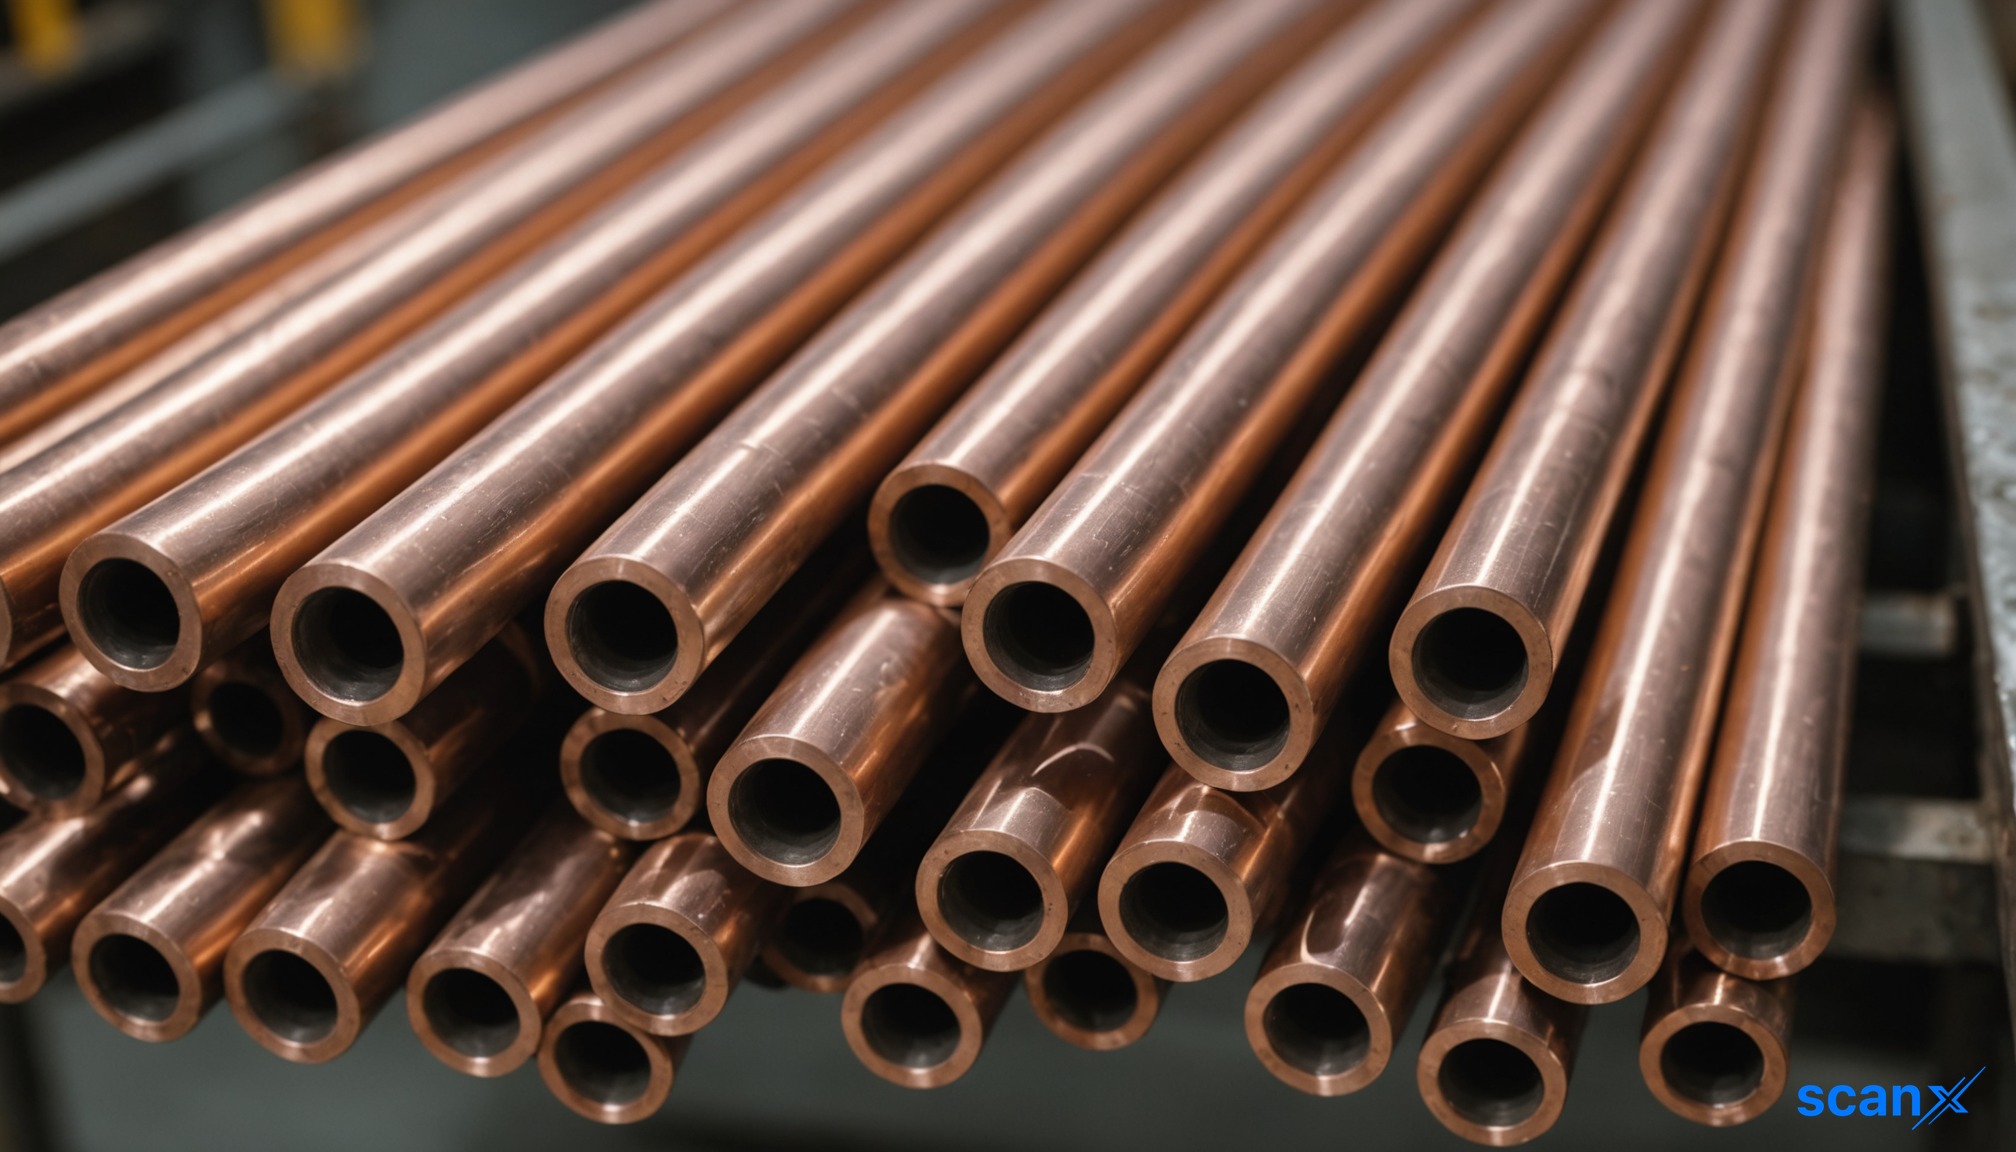

*this image is generated using AI for illustrative purposes only.
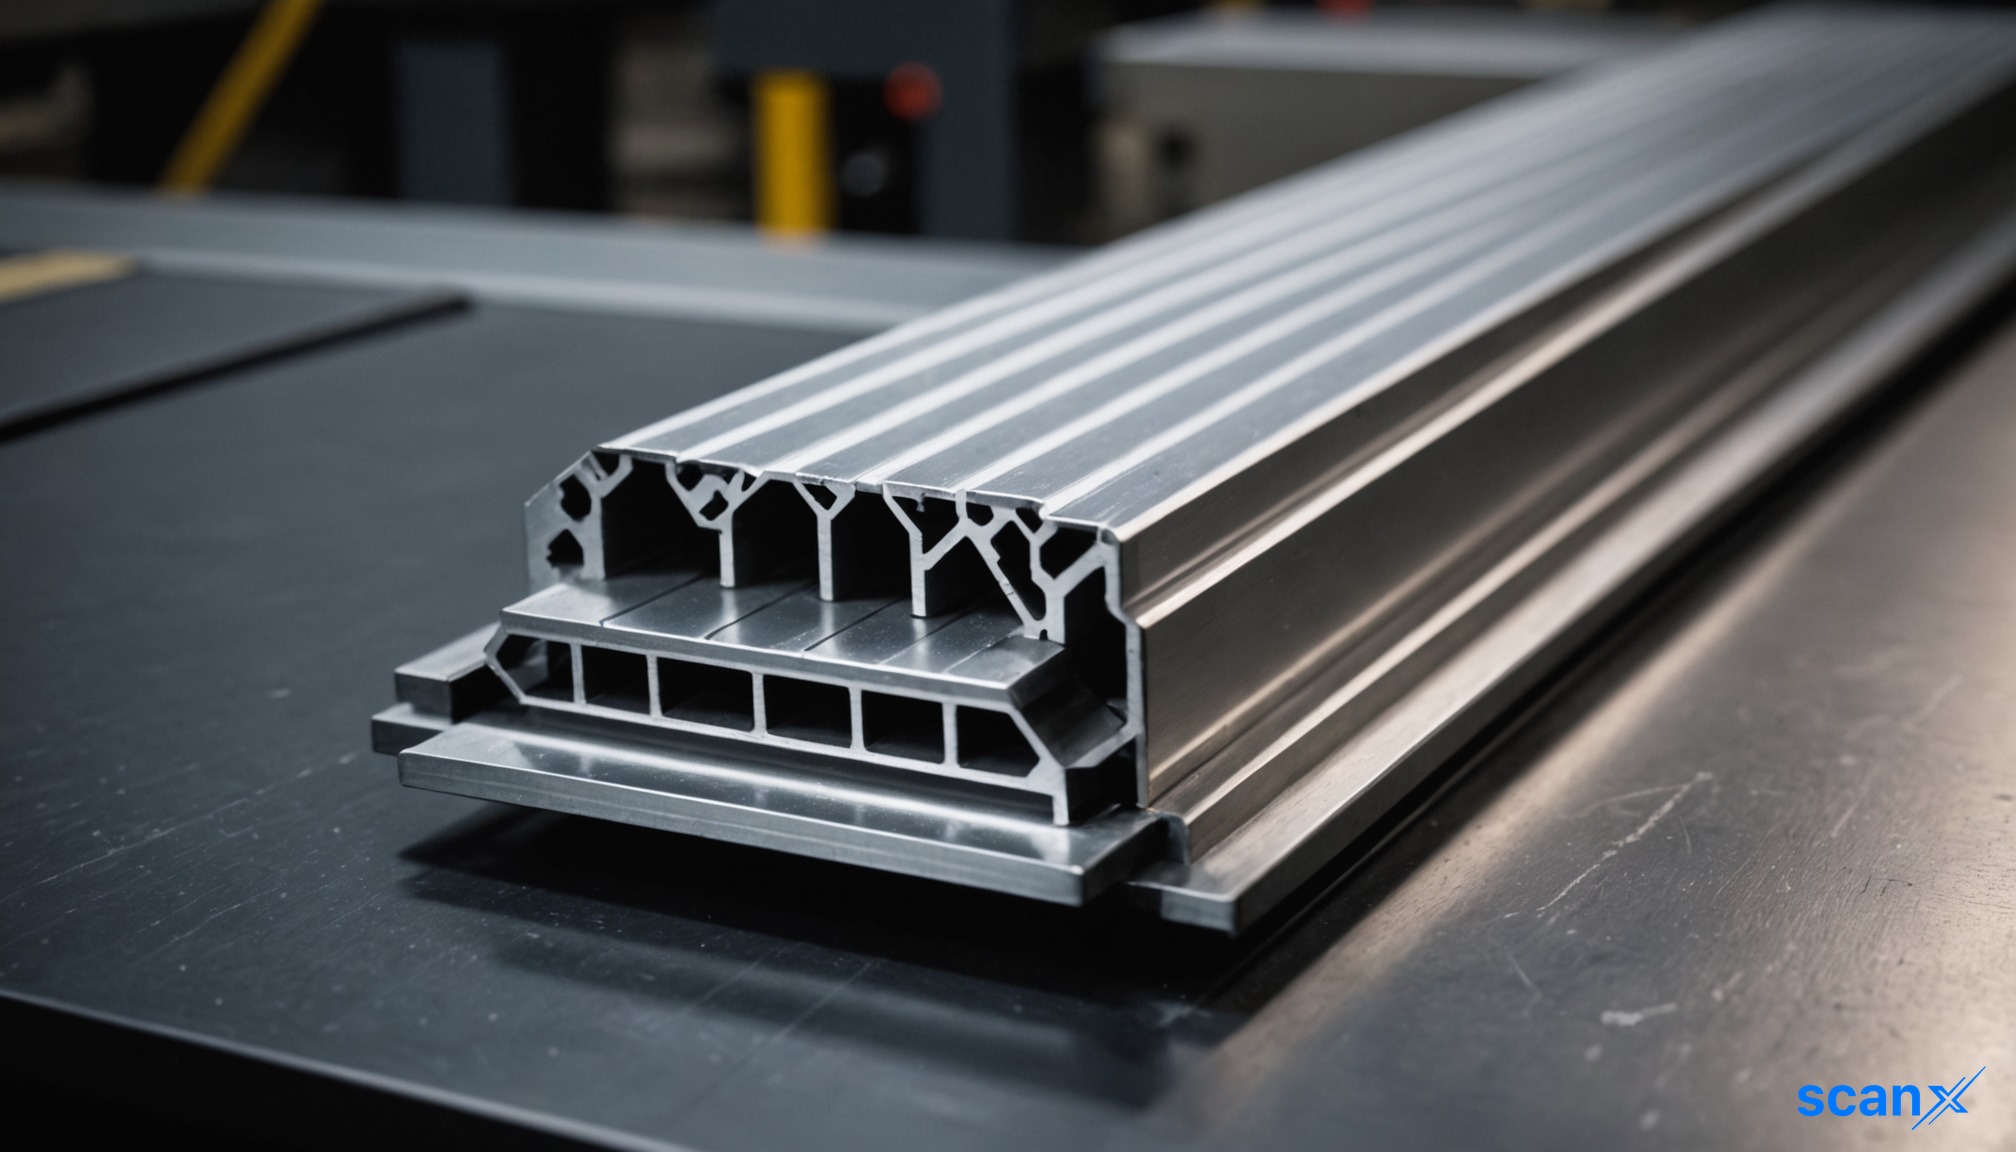
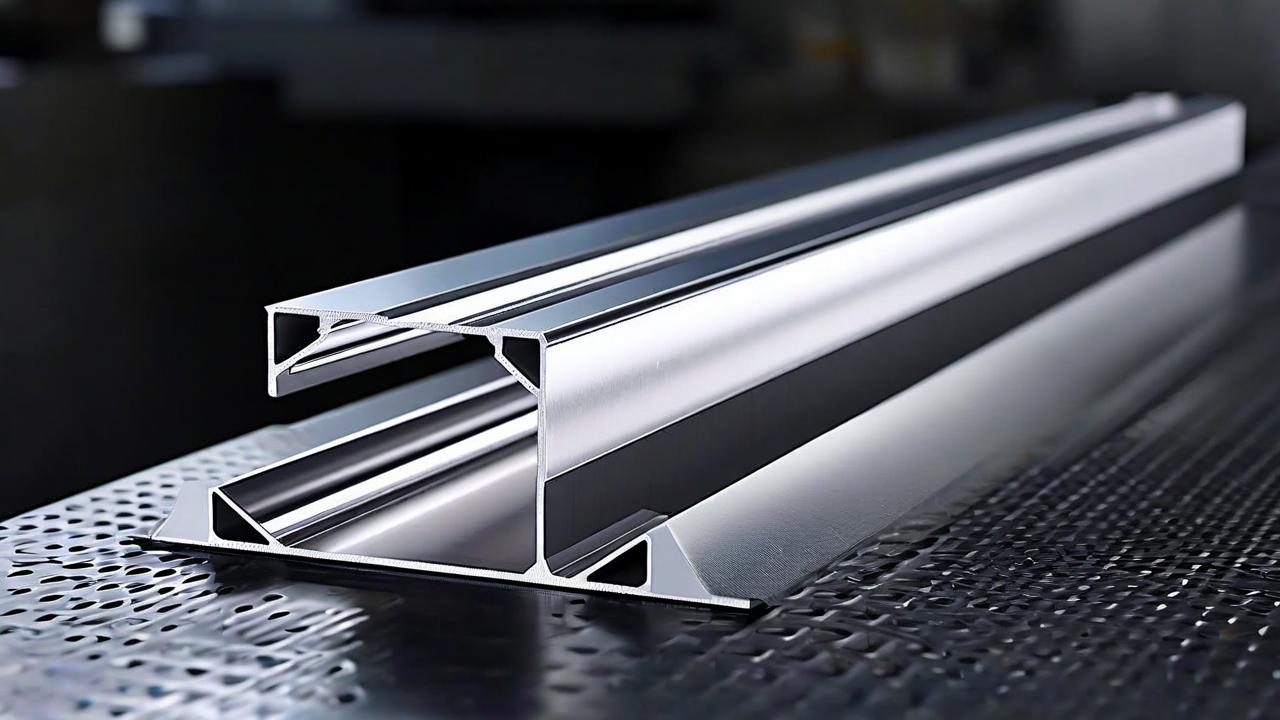
Baroda Extrusion has received a confirmed work order valued at Rs 27.8301348 crore for the supply of copper alloy products including Copper Flats, Pipes, Rods, Hex Bars, Coils, Nuggets, Anodes, and Profiles/Sections.
Order in Financial Context
This confirmed order (Type A) carries a value of Rs 27.8301348 crore. The total disclosed order book stands at Rs 27.8301348 crore (sum of the 1 order disclosed across the last 3 fiscal quarters shown in the table below). Given that the Trailing Twelve Month (TTM) revenue is reported as Rs 0.0 Cr, the book-to-bill ratio is effectively undefined or infinite relative to current run-rate revenue, indicating that this single order constitutes the entirety of the currently visible forward-looking revenue pipeline in the disclosed data. The average quarterly revenue context is not computable from the provided TTM data which shows zero revenue.
Company Order Track Record
No previous order disclosures were found for Baroda Extrusion in the last 3 fiscal quarters prior to this filing. Consequently, there is no historical quarterly inflow data to compare against for velocity or consistency analysis. The current order represents a distinct event in the disclosed record.
| Quarter | Total Order Inflow (Rs Cr) | Key Awarding Entities |
|---|---|---|
| Q1FY27 (Apr-Jun 2026) | 27.8301348 | Not specified in filing |
Execution and Revenue Quality
The company's financial data indicates a challenging recent operational period. The Trailing Twelve Month (TTM) consolidated P&L reports Revenue, Net Profit, EBITDA, and Operating Profit all at Rs 0.0 Cr, with an Operating Profit Margin (OPM) of 0.0%. This suggests that either no significant revenue was recognized in the last four quarters or the data reflects a dormant period. The new order will be critical in restarting revenue generation. There are no quarterly breakdowns available for the last 3 quarters to assess OPM trends during this zero-revenue phase.
Revenue Growth - Order Wins Translating to Revenue
Historical standalone data shows volatility. Revenue growth was +15.5% in FY26, following +24.6% in FY25, and a decline of -2.1% in FY24. However, profit growth in FY26 was negative at -62.8%. The recent order inflow needs to translate into actual revenue recognition to reverse the trend of declining profitability seen in FY26.
Working Capital and Execution Capacity
Data regarding current ratio, total liabilities/equity, operating cashflow, and free cashflow is not available in the provided input. Therefore, an assessment of liquidity to execute the Rs 27.83 crore order or the efficiency of backlog conversion into cash cannot be performed based on the supplied figures.
What to Watch
- Revenue Recognition: Watch for the first quarter where this order contributes to reported revenue, given the TTM revenue of Rs 0.0 Cr.
- Margin Quality: Monitor if the OPM on this new order exceeds the historical averages, especially since FY26 profit growth was -62.8%.
- Client Concentration: The client name is not specified in the provided text; monitoring future disclosures for client identity is essential to assess concentration risk.
- Execution Rate: Since there is no prior backlog history, the speed at which this specific order converts to billed revenue will be the primary metric for execution capacity.
Key Observations
- Backlog signal: Book-to-bill is effectively infinite relative to TTM revenue of Rs 0.0 Cr; the entire disclosed order book rests on this single contract.
- Valuation check (as of 01 Oct 2026): P/E of 20.1x against ROCE of 38.75%. At the time of this article, valuation was pricing in execution improvement not yet visible in return ratios. (P/E is price-derived and will change; ROCE is from audited financials)
- Promoter holding: Stable at 54.94% in Q1FY27, unchanged from Q4FY26.
Historical Stock Returns for Baroda Extrusion
| 1 Day | 5 Days | 1 Month | 6 Months | 1 Year | 5 Years |
|---|---|---|---|---|---|
| -4.34% | -9.87% | -3.32% | +16.80% | +6.10% | +303.57% |

 18
18








 Access 50+ Readymade Screeners
  Use 200+ Custom Filters
  Get Full Market Insights





