

Apple P/E rises to 39.33 as revenue growth lags industry average


- Apple's P/E ratio stands at 39.33, representing a 1.01x premium over the industry average
- Revenue growth of 16.36% significantly trails the sector average of 60.55%
- Return on Equity of 27.84% exceeds the peer group average by 7.36%
- Debt-to-equity ratio of 0.78 indicates lower reliance on debt financing compared to top peers



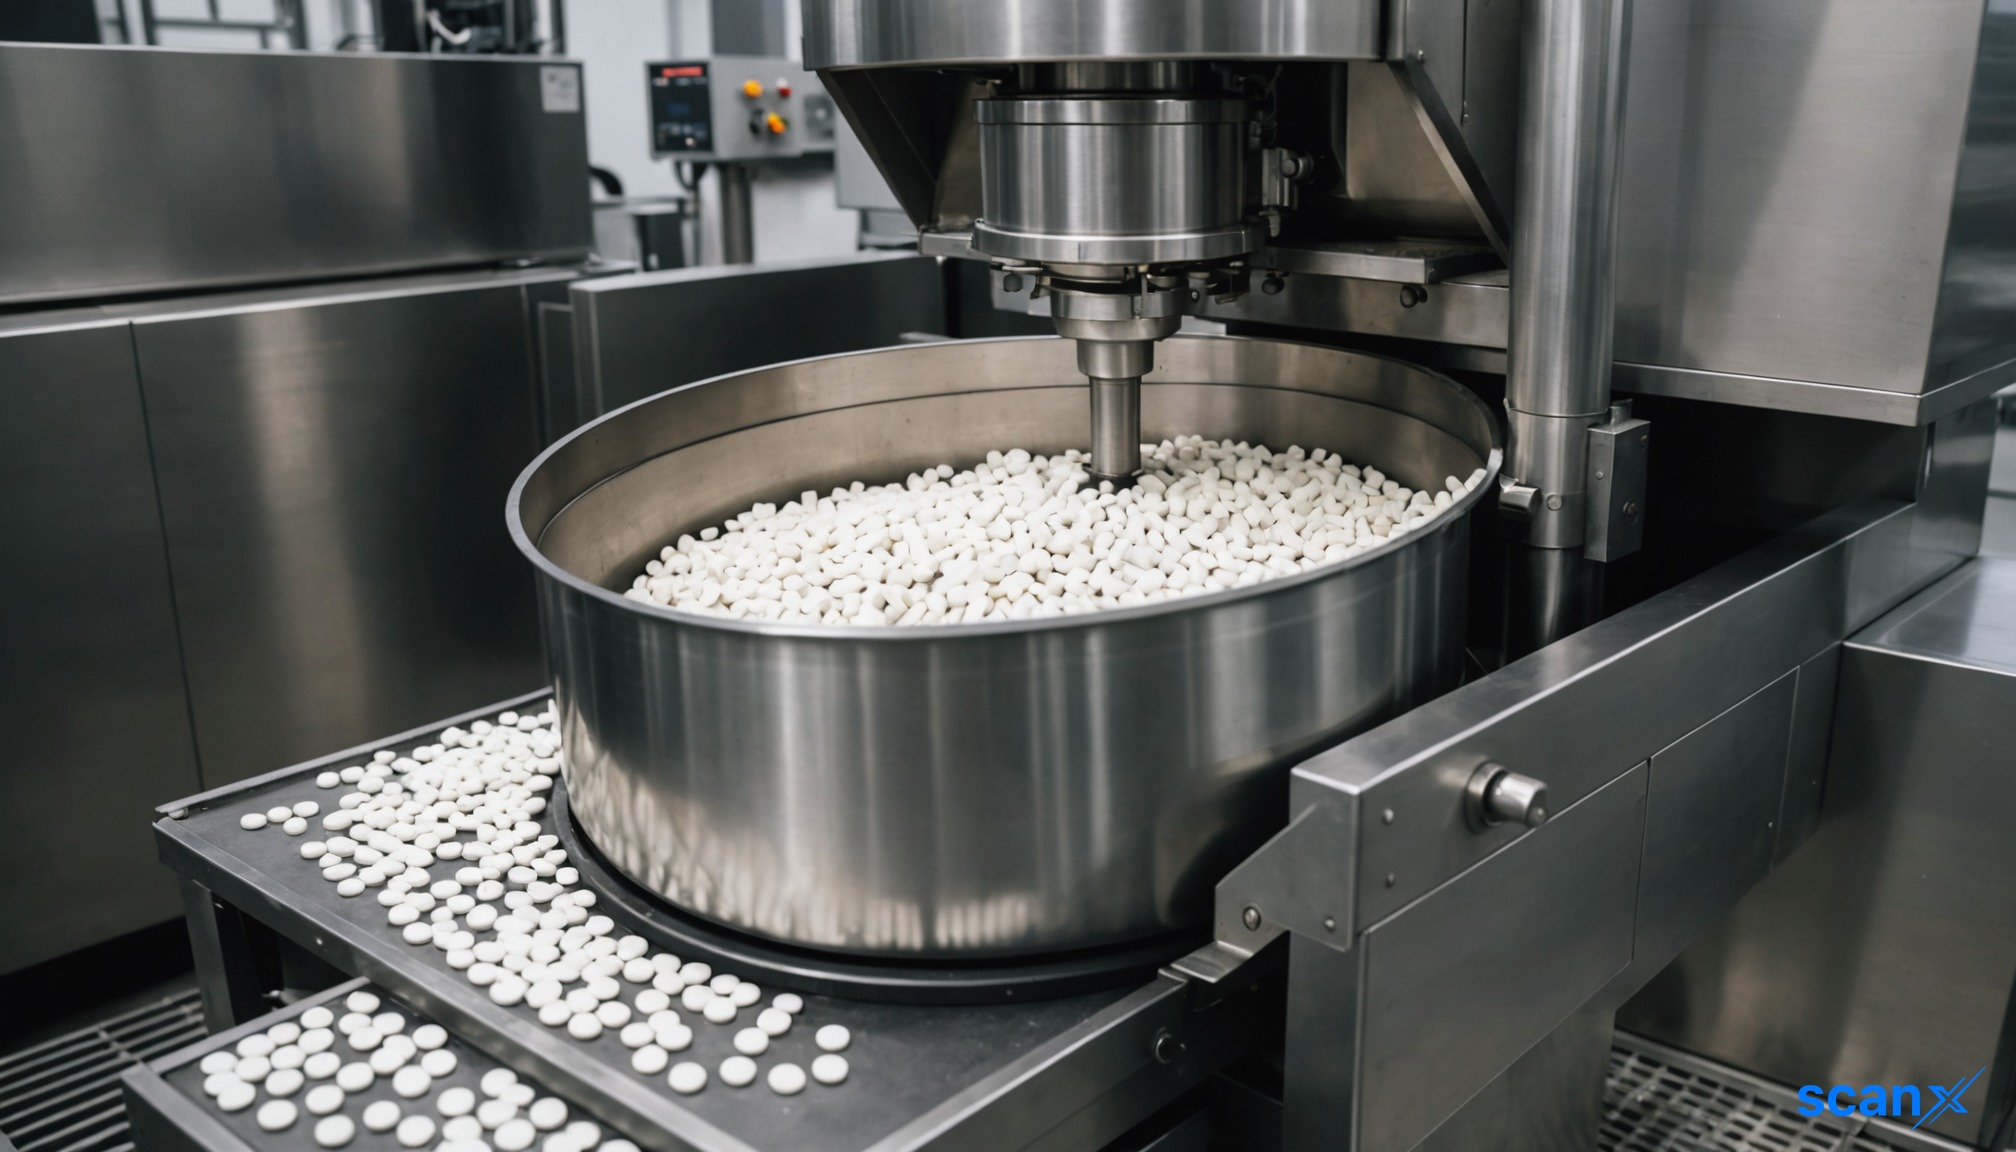
*this image is generated using AI for illustrative purposes only.
Apple Inc maintains a Price to Earnings ratio of 39.33, which is 1.01x above the industry average, indicating a premium valuation relative to its Technology Hardware, Storage & Peripherals competitors.
Despite this valuation premium, Apple's revenue growth of 16.36% significantly trails the industry average of 60.55%. The company's operational efficiency remains strong, with a Return on Equity of 27.84%, which is 7.36% higher than the peer group average.
Financial metrics comparison
The following table compares key financial metrics for Apple against major competitors in the hardware and storage sector.
| Company | P/E | P/B | P/S | ROE | EBITDA ($B) | Gross Profit ($B) | Revenue Growth |
|---|---|---|---|---|---|---|---|
| Apple Inc | 39.33 | 46.55 | 10.86 | 27.84% | $39.02 | $54.77 | 16.36% |
| SanDisk Corp | 18.59 | 12.59 | 10.50 | 46.78% | $7.89 | $7.58 | 371.59% |
| Seagate Technology Holdings PLC | 47.54 | 69.34 | 12.41 | 79.34% | $1.64 | $1.9 | 48.49% |
| Western Digital Corp | 13.08 | 14.87 | 10.44 | 34.3% | $3.36 | $2.03 | 43.84% |
| Hewlett Packard Enterprise Co | 28.80 | 2.80 | 1.89 | 5.83% | $2.33 | $4.9 | 33.68% |
| Everpure Inc | 174.10 | 27.48 | 10.34 | 4.97% | $0.11 | $0.81 | 37.73% |
| NetApp Inc | 29.29 | 27.25 | 5.62 | 26.35% | $0.55 | $1.42 | 29.89% |
| Super Micro Computer Inc | 9.85 | 2.06 | 0.57 | 12.83% | $1.57 | $1.94 | 93.16% |
| Logitech International SA | 19.70 | 6.54 | 3.21 | 10.33% | $0.28 | $0.61 | 6.93% |
| Diebold Nixdorf Inc | 22.37 | 2.37 | 0.63 | 1.56% | $0.09 | $0.24 | 1.7% |
| Corsair Gaming Inc | 42.19 | 2.13 | 0.97 | 1.04% | $0.02 | $0.1 | -1.8% |
| Immersion Corp | 20.82 | 0.79 | 0.14 | 1.93% | $0.01 | $0.06 | 0.81% |
| Average | 38.76 | 15.29 | 5.16 | 20.48% | $1.62 | $1.96 | 60.55% |
Valuation and profitability analysis
Apple's Price to Book ratio of 46.55 is 3.04x the industry average, indicating a premium valuation based on book value. Similarly, the Price to Sales ratio of 10.86 is 2.1x the industry average, reflecting high market expectations relative to sales performance.
In terms of absolute profitability, Apple's EBITDA of $39.02 billion is 24.09x the industry average. Its gross profit of $54.77 billion stands at 27.94x the industry average, highlighting robust cash flow generation and strong margins from core operations.
Debt to equity position
Apple exhibits a lower reliance on debt financing compared to its top four peers. With a debt-to-equity ratio of 0.78, the company maintains a stronger financial position and a more favorable balance between debt and equity than competitors in the sector.
What the numbers show
A divergence exists between Apple's valuation multiples and its growth trajectory. While the company commands a premium on book value (46.55) and sales (10.86), its revenue growth of 16.36% is substantially lower than the industry average of 60.55%. This suggests that while investors are paying a premium for Apple's established market position and high profitability (EBITDA $39.02 billion), they are doing so despite slower top-line expansion compared to faster-growing peers like SanDisk Corp (371.59% revenue growth).

How might Apple's new AI features in the iPhone 16 lineup impact its revenue growth trajectory to narrow the gap with faster-growing peers?
What specific services or hardware segments are driving the divergence between Apple's 16.36% revenue growth and the 60.55% industry average?
Can Apple sustain its 39.33 P/E premium if high-growth competitors like SanDisk continue to expand market share in storage and peripherals?







 Access Market Heat-map & Insights
 Create, Save & Share your Screener
 Use 200+ Screening Filters





