

Gold, silver, Bitcoin rally as inflation turns negative


Gold, silver, and Bitcoin are rallying as negative inflation readings and falling oil prices reduce expectations for Federal Reserve rate hikes. The Cleveland Fed’s nowcast shows negative month-over-month consumer prices for June and July, while WTI crude has slumped to around $68 a barrel. The sustainability of this relief rally depends on whether disinflation proves durable, with core inflation remaining firm at 3.4%.



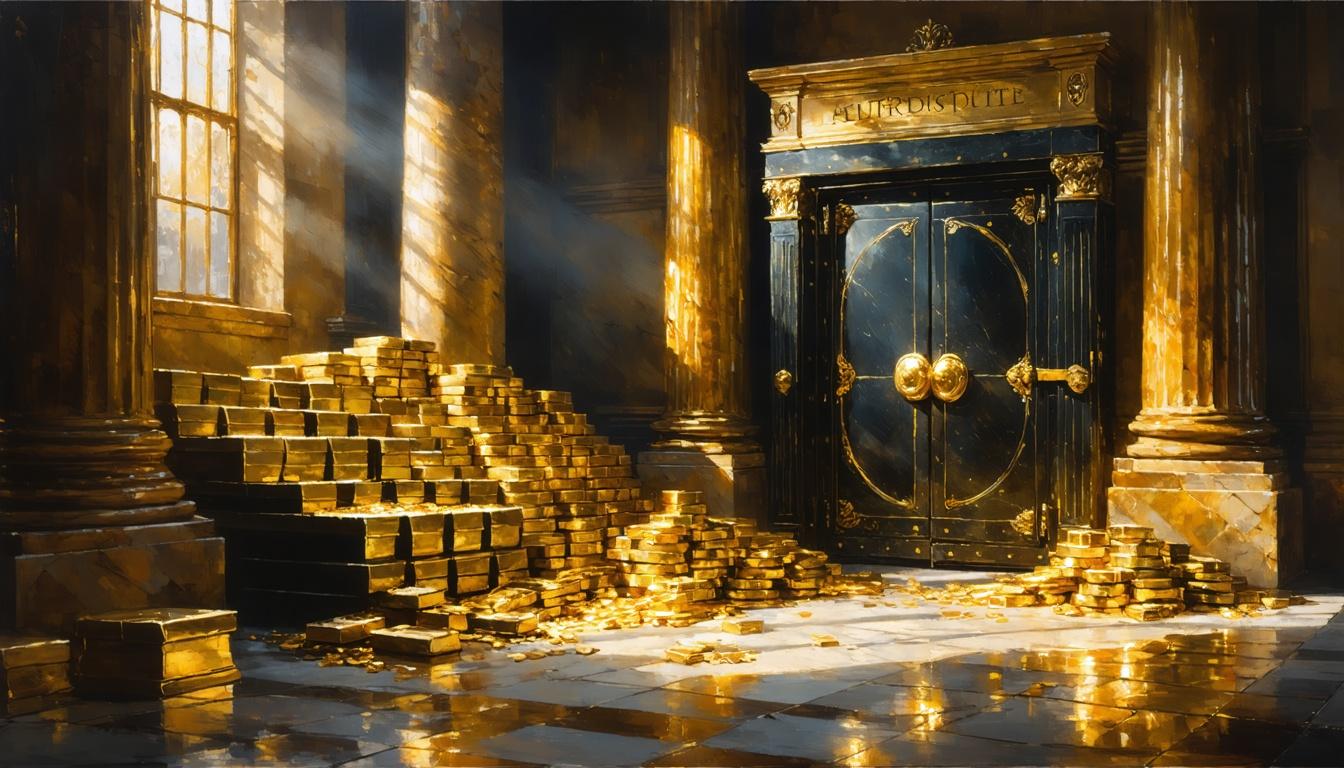
*this image is generated using AI for illustrative purposes only.
Gold, silver, and Bitcoin are rallying as negative inflation readings and falling oil prices reduce expectations for Federal Reserve rate hikes, reversing a trend that punished these assets for most of 2026. The Cleveland Fed’s inflation nowcast shows headline consumer prices at minus 0.06% for June and minus 0.22% for July, marking a sharp disinflationary shift. WTI crude has slumped to around $68 a barrel, returning to late-February levels before the war in Iran disrupted supply.
The decline in energy prices follows the mid-June agreement between the United States and Iran to halt fighting and reopen the Strait of Hormuz, allowing Gulf supply to flood back into the market. Saudi Aramco cut the official price of its flagship Arab Light grade to Asia for August by $11 a barrel, swinging it from a $9.50 premium to a $1.50 discount over the regional benchmark. This reduction was the deepest in at least 26 years, surpassing analyst expectations for an $8 cut.
Economic Data Shifts Rate Expectations
Despite a still-expanding U.S. economy running at around 2% growth, recent labor market data has softened the hawkish case for monetary policy. The U.S. economy added just 57,000 nonfarm payrolls in June, missing the roughly 110,000 estimate, with prior months revised lower. In response, traders reduced the odds of a September rate hike from around 66% to near 53%, and the policy-sensitive 2-year Treasury yield eased toward 4.13%.
| Metric | Value |
|---|---|
| June Inflation (MoM) | -0.06% |
| July Inflation (MoM) | -0.22% |
| June Nonfarm Payrolls | 57,000 |
| Expected Payrolls | 110,000 |
| WTI Crude Price | ~$68/barrel |
| September Hike Odds | ~53% |
| 2-Year Treasury Yield | ~4.13% |
Asset Correlation and Market Mechanics
The rebound in non-yielding assets is driven by an unwinding of Fed-hike positioning. Jordi Visser, a strategist at 22V Research, noted that if the Fed-hike positioning unwinds, it benefits gold, silver, and Bitcoin. When the market prices in high rates, the opportunity cost of holding these assets rises, making Treasurys more appealing. Conversely, a dovish repricing reverses that calculation. Gold and Bitcoin are currently moving in lockstep, with a 60-day correlation of 0.92, indicating they are trading as a single macro expression of the same rate view.
Risks to the Rally
The sustainability of the relief rally depends on whether the disinflation is real and durable. The current drop is almost entirely driven by energy, while core inflation remains firm. The Fed’s preferred core PCE gauge stands at 3.4%, and average hourly earnings are still running around 3.5% year-over-year. Fed Chair Kevin Warsh noted that inflation expectations have come down in recent weeks, but the central bank remains focused on inflation data. The June CPI report, due July 14, will be a decisive data point for future policy direction.

Will the upcoming June CPI report confirm the disinflationary trend or reveal persistent core inflation pressures?
How might the Fed react if core inflation remains elevated despite the drop in energy prices?
Could the current rally in gold, silver, and Bitcoin sustain if rate hike expectations rebound?
 16
16










 Access Market Heat-map & Insights
  Create, Save & Share your Screener
  Use 200+ Screening Filters





