

Nokia stock falls nearly 3% as market weakness hits tech shares


- Nokia shares fell 2.73% to $10.34 Thursday, pressured by broad market weakness that sent the Nasdaq down 0.73% and the S&P 500 down 0.40%
- The stock trades 14.2% below its 100-day SMA of $11.95, though it remains above its 50-day SMA of $10.05 and 200-day SMA of $9.89
- RSI stands at 47.99, a neutral reading; resistance sits near $11 and support near $9.50
- Nokia carries a Buy consensus rating with an average price forecast of $16.50; JPMorgan holds an Overweight rating with a $21 target
- Benzinga Edge Momentum score stands at 93.27, with Quality at 47.26, Value at 45.94, and Growth at 46.63

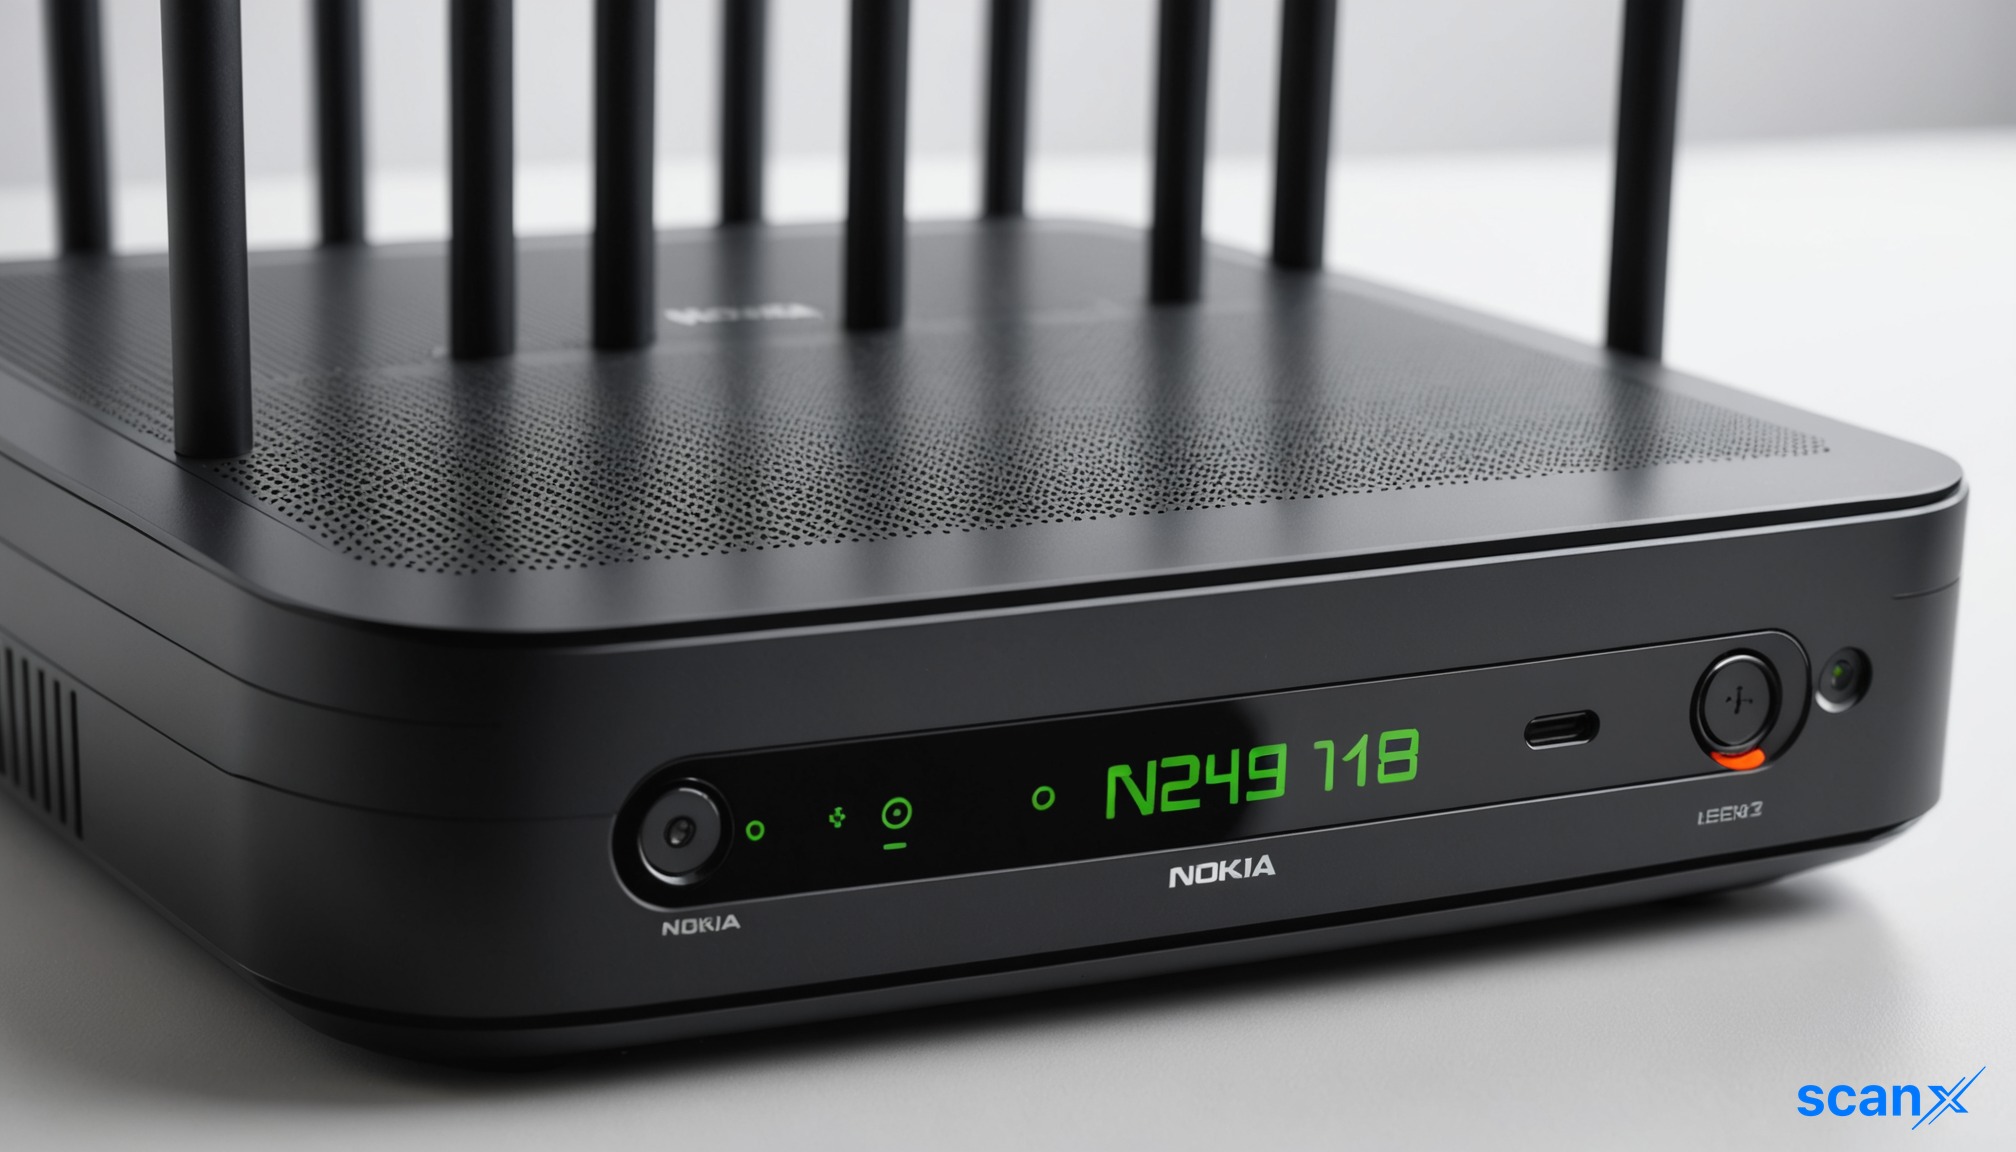

*this image is generated using AI for illustrative purposes only.
Nokia Corporation (NYSE: NOK) shares fell 2.73% to $10.34 Thursday as broader market weakness weighed on technology stocks. The Nasdaq fell 0.73%, while the S&P 500 declined 0.40%.
Investors turned defensive as equities weakened. Stocks that have posted strong gains over the past year can also face heavier profit-taking during risk-off sessions.
Strategic Developments
Nokia is expanding its collaboration with Microsoft Corporation (NASDAQ: MSFT) to enhance its AI and cloud presence. The partnership combines Nokia Data Suite with Microsoft Fabric, enabling telecom operators to access network data more rapidly for AI-driven operations. This integration aims to streamline network automation through a unified data foundation.
Technical Analysis
Nokia remains in a longer-term bullish trend, with its 50-day simple moving average (SMA) above its 200-day SMA following a golden cross that formed in October 2025. However, the intermediate trend has weakened. Nokia is trading about 14.2% below its 100-day SMA of $11.95, placing the $12 area in focus as potential resistance.
The stock is hovering near its 20-day SMA of $10.36 and slightly below its 20-day exponential moving average of $10.41. Nokia remains about 2% above its 50-day SMA of $10.05 and 3.7% above its 200-day SMA of $9.89. The relative strength index stands at 47.99, a neutral reading indicating the stock is neither overbought nor oversold.
Resistance sits near $11, while support is near $9.50. A break below that support level could put the 200-day moving average back in focus.
| Metric | Value | Status |
|---|---|---|
| Current price | $10.34 | Down 2.73% |
| 20-day SMA | $10.36 | Hovering near |
| 50-day SMA | $10.05 | Trading above |
| 100-day SMA | $11.95 | Trading below |
| 200-day SMA | $9.89 | Trading above |
| RSI | 47.99 | Neutral |
What the Numbers Show
A divergence persists between short-term and intermediate-term trend lines. While Nokia trades above both its 50-day ($10.05) and 200-day ($9.89) SMAs, it remains significantly below the 100-day SMA ($11.95). This gap indicates that while the longer-term structural trend is intact, the stock has not recovered to intermediate-term levels, leaving a clear distance between current price and the $11 resistance area.
Analyst Outlook
Nokia trades at a price-to-earnings ratio of about 77.3. The stock carries a Buy consensus rating with an average price forecast of $16.50. Coverage details are outlined below.
| Analyst | Rating | Price target | Action |
|---|---|---|---|
| B. Riley Securities | Buy | $15 | Initiated coverage Sept. 17 |
| Rosenblatt | Buy | $15 | Initiated coverage Sept. 15 |
| JPMorgan | Overweight | $21 | Maintained, raised target in June |
ETF Exposure and Benzinga Edge Rankings
The Spear Alpha ETF (NASDAQ: SPRX) holds a 4.15% weighting in Nokia, highlighting its significance within specific momentum-focused funds. Fund inflows or outflows can create additional buying or selling pressure in stocks with meaningful ETF exposure.
Nokia recorded a Benzinga Edge Momentum score of 93.27, reflecting strong longer-term price performance. Its Quality score stands at 47.26, Value at 45.94, and Growth at 46.63, placing those three factors closer to the middle of the market. Momentum remains Nokia's strongest factor.

How might the integration of Nokia Data Suite with Microsoft Fabric impact Nokia's competitive positioning against other telecom infrastructure providers?
Can Nokia sustain its high momentum score if broader market risk-off sentiment continues to pressure technology valuations?
What specific operational efficiencies or revenue synergies are expected from the Microsoft partnership to justify the current premium P/E ratio of 77.3?
 19
19














 Access Market Heat-map & Insights
  Create, Save & Share your Screener
  Use 200+ Screening Filters





