GAIL India Reports Mixed Performance in H1 FY26 with Revenue Decline Despite Volume Growth


GAIL (India) Limited reported mixed results for H1 FY26. Natural gas transmission volume increased by 7.60% to 105.47 MMSCMD. However, standalone turnover decreased by 33.25% to ₹91,426.00 crore, EBITDA fell by 44.76% to ₹8,608.00 crore, and profit after tax declined by 48.84% to ₹5,302.00 crore. The company maintains a strong financial position with a debt-equity ratio of 0.20 and plans ₹10,700.00 crore capital expenditure for FY2025-26, focusing on pipelines, city gas distribution, and petrochemicals.


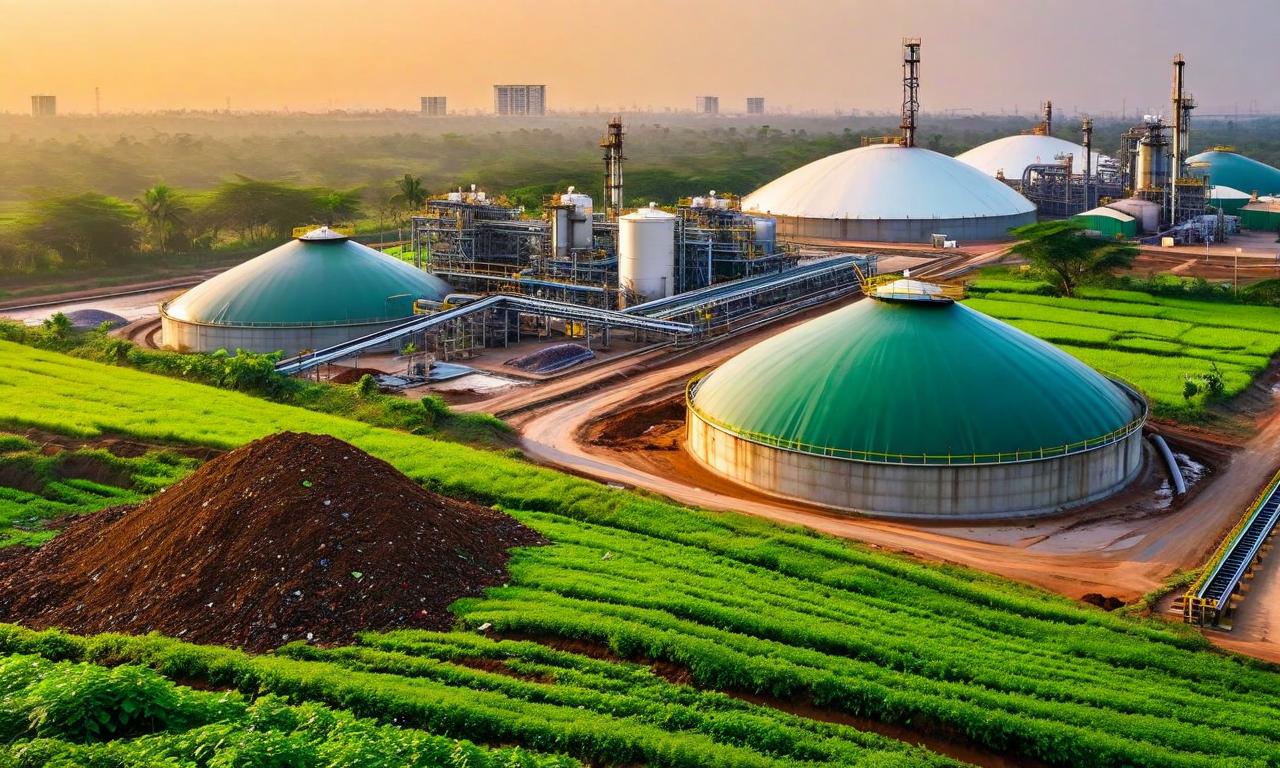
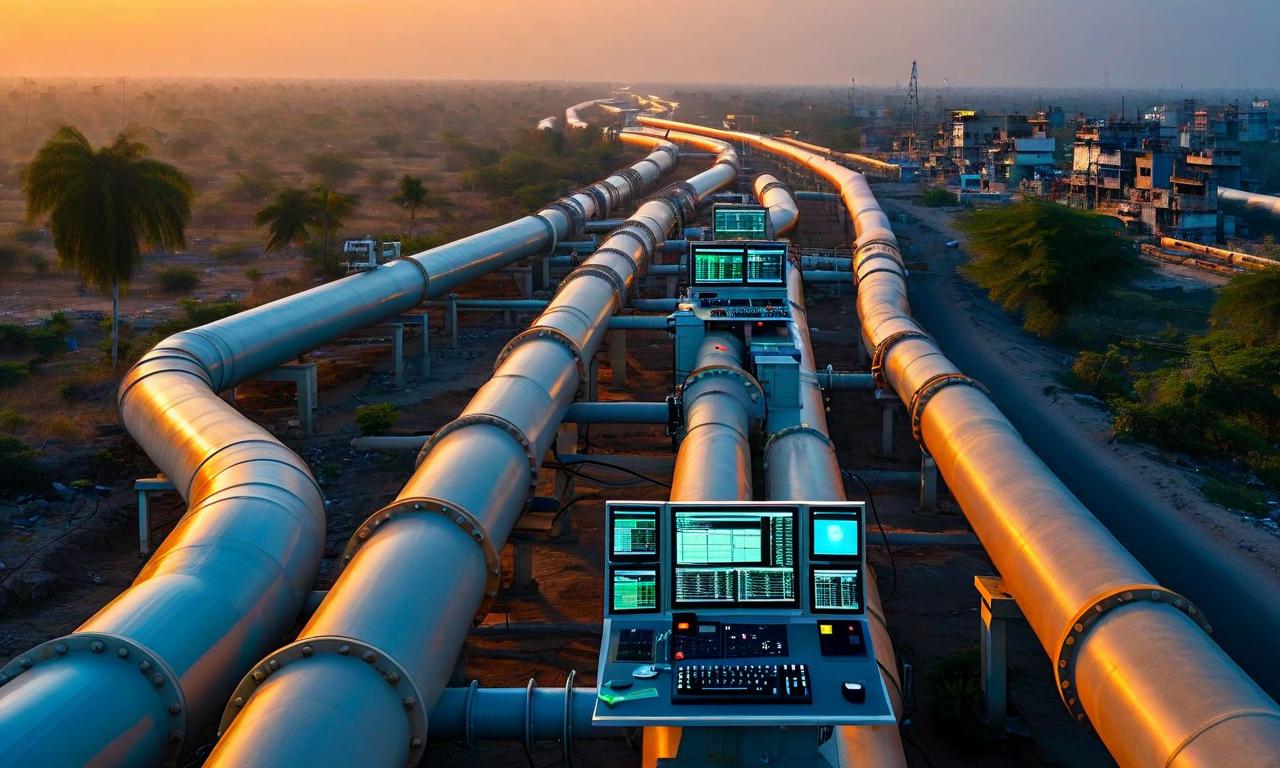
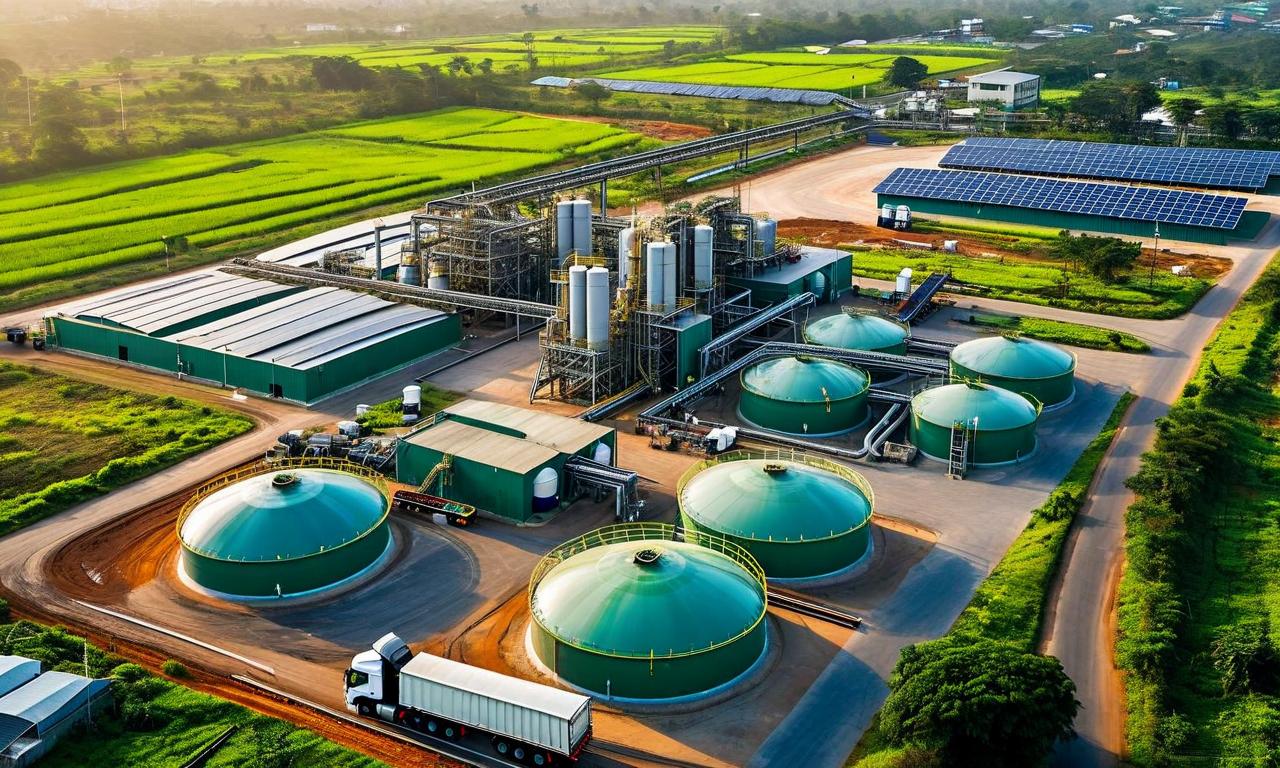
*this image is generated using AI for illustrative purposes only.
GAIL (India) Limited , the country's largest gas transmission and distribution company, has reported mixed financial results for the first half of fiscal year 2026. The state-owned entity saw increases in natural gas transmission volumes but experienced declines in turnover and profitability.
Financial Highlights
| Metric | H1 FY26 | H1 FY25 | YoY Change |
|---|---|---|---|
| Natural Gas Transmission Volume | 105.47 MMSCMD | 98.02 MMSCMD | +7.60% |
| Standalone Turnover | ₹91,426.00 crore | ₹1,36,960.00 crore | -33.25% |
| Gross Margin (EBITDA) | ₹8,608.00 crore | ₹15,583.00 crore | -44.76% |
| Profit After Tax | ₹5,302.00 crore | ₹10,364.00 crore | -48.84% |
Year-on-Year Analysis
Natural Gas Transmission Volume
GAIL's natural gas transmission volume increased from 98.02 MMSCMD to 105.47 MMSCMD, representing a 7.60% growth year-on-year.
Standalone Turnover
Despite the volume growth, the company's standalone turnover decreased significantly from ₹1,36,960.00 crore to ₹91,426.00 crore, marking a 33.25% decline.
Gross Margin (EBITDA)
The gross margin (EBITDA) saw a substantial decrease from ₹15,583.00 crore to ₹8,608.00 crore, a reduction of 44.76%.
Profit After Tax
Profit after tax declined sharply from ₹10,364.00 crore to ₹5,302.00 crore, representing a 48.84% decrease.
Consolidated Performance and Financial Position
On a consolidated basis, GAIL reported a turnover of ₹92,636.00 crore with an EBITDA of ₹10,323.00 crore in H1 FY26. The company maintains a debt-equity ratio of 0.20, indicating a strong financial position.
Future Plans
GAIL has outlined capital expenditure plans of ₹10,700.00 crore for FY2025-26, focusing on key areas:
- Pipelines (28%)
- City gas distribution equity (26%)
- Petrochemicals (18%)
The company's major gas demand comes from fertilizer and city gas distribution companies. GAIL's gas supply primarily consists of long-term RLNG and spot purchases for imported gas.
Market Position and Outlook
GAIL's mixed performance in H1 FY26 presents a complex picture of the company's operations. The increase in natural gas transmission volumes suggests growing demand and improved infrastructure utilization. However, the significant declines in turnover, EBITDA, and profit after tax indicate challenges in revenue generation and profitability.
The company's planned capital expenditure demonstrates a commitment to future growth and infrastructure development. The focus on pipelines, city gas distribution, and petrochemicals aligns with India's push towards increased natural gas usage and cleaner energy sources.
GAIL's low debt-equity ratio suggests a strong financial foundation, which may provide resilience in navigating market fluctuations and supporting future investments.
As India continues to prioritize cleaner energy sources, GAIL's position as the largest gas transmission and distribution company in the country remains crucial. The company's ability to grow its transmission volumes, despite the financial challenges, indicates ongoing demand for its services.
Investors and industry observers may view these results with caution. While the growth in transmission volumes is encouraging, the significant declines in financial metrics warrant closer attention to the company's revenue generation strategies and cost management in the coming quarters.
Historical Stock Returns for GAIL
| 1 Day | 5 Days | 1 Month | 6 Months | 1 Year | 5 Years |
|---|---|---|---|---|---|
| -0.56% | +0.87% | -2.42% | +6.35% | -6.03% | +80.46% |