

Tempsens Instruments Q1FY27 Results: Net profit up 16% YoY to ₹162.7 million


- Consolidated net profit rose 15.5% YoY to ₹162.7 million in Q1FY27
- Revenue grew 33.4% YoY to ₹1,187.1 million, driven by subsidiary performance
- EBITDA margin contracted to 20.59% from 23.61% despite higher sales
- Standalone net profit increased modestly by 2.9% YoY to ₹129.3 million

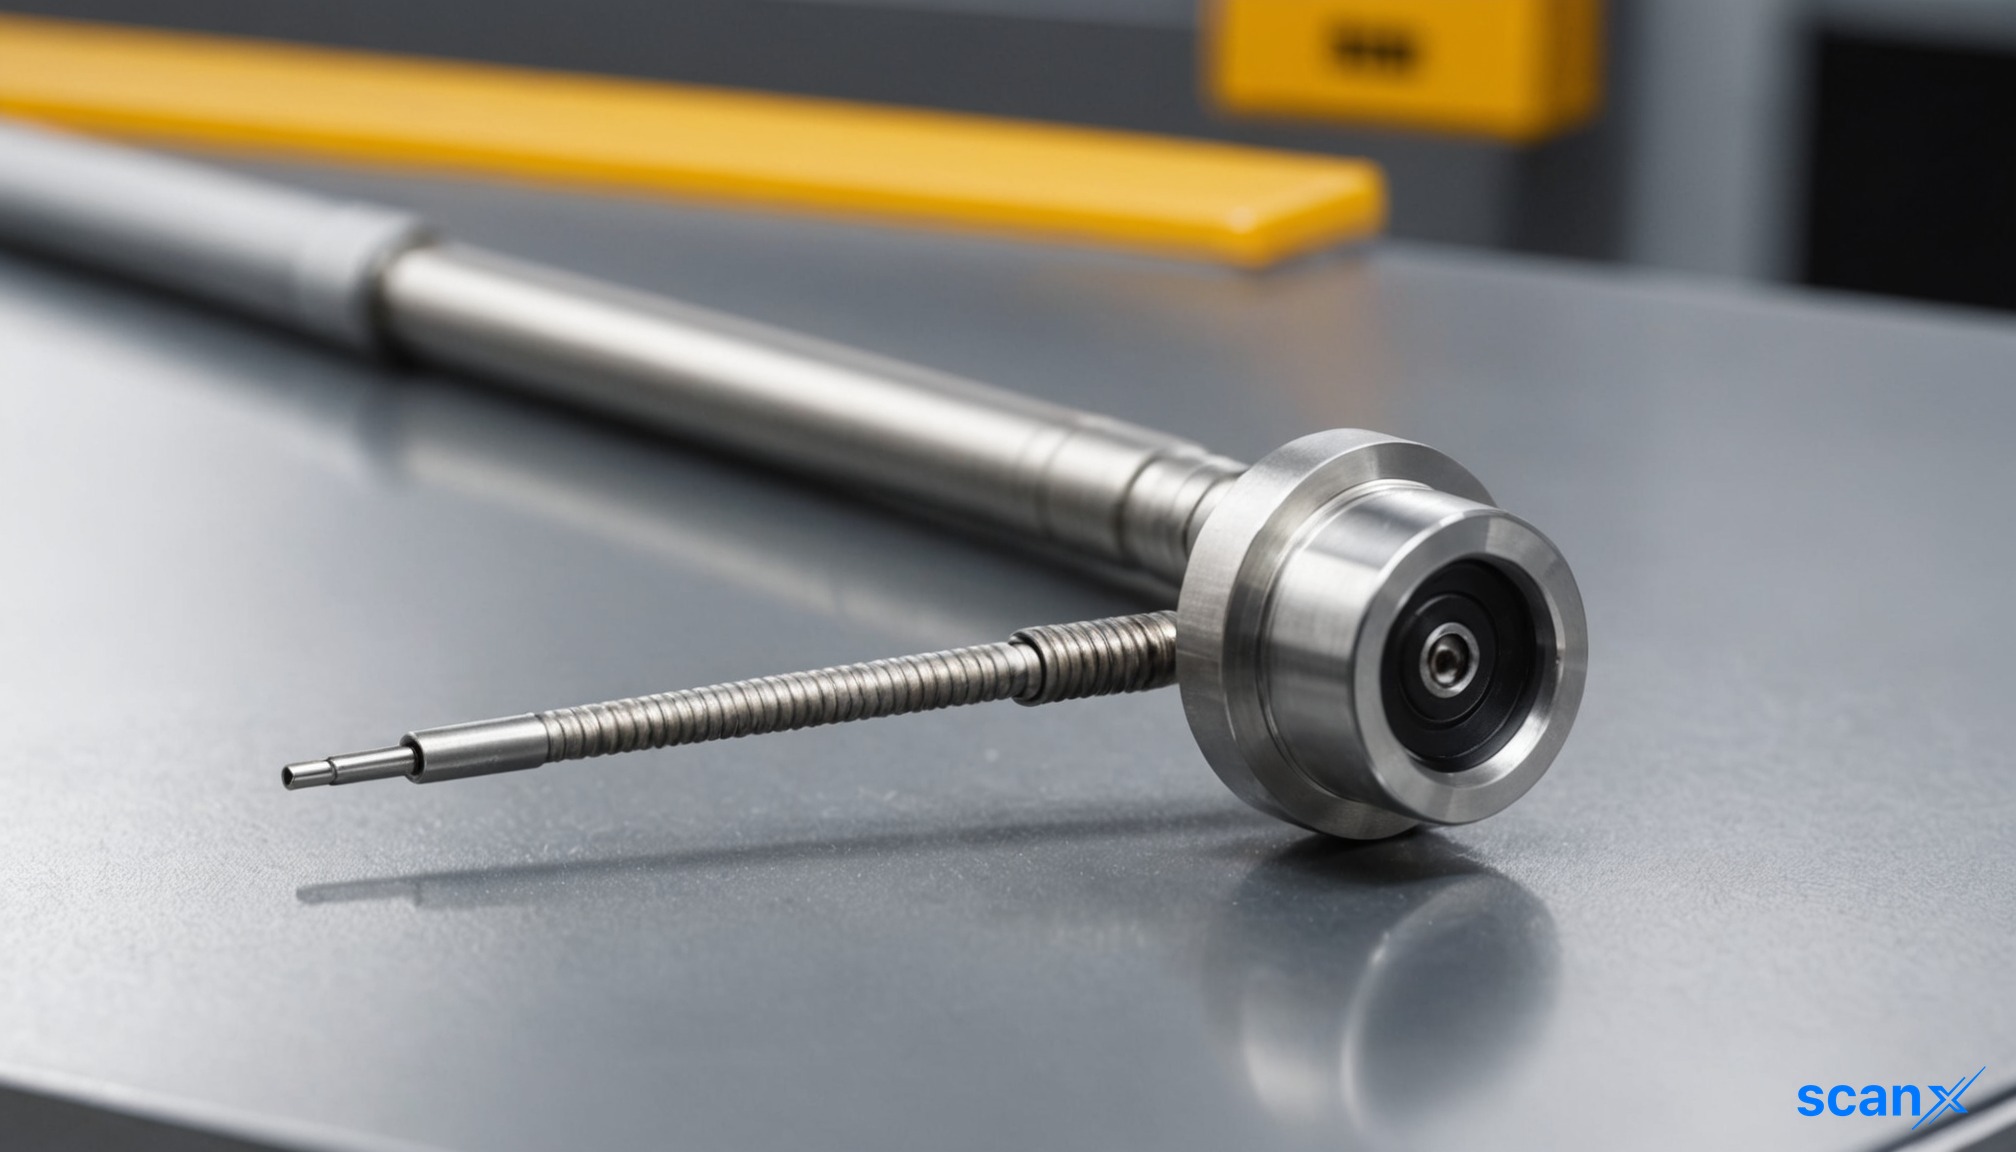

*this image is generated using AI for illustrative purposes only.
Tempsens Instruments reported a 15.5% year-on-year increase in consolidated net profit to ₹162.7 million for the quarter ended June 30, 2026 (Q1FY27). Revenue from operations grew 33.4% YoY to ₹1,187.1 million, marking the company’s first disclosed quarterly results after its initial public offering.
The Udaipur-based manufacturer of industrial temperature and pressure sensors saw its standalone net profit rise 2.9% YoY to ₹129.3 million, while standalone revenue increased 21.9% to ₹1,018.5 million. The Board of Directors approved the unaudited financial results in a meeting held on September 16, 2026.
Consolidated Financial Performance
Consolidated revenue from operations stood at ₹1,187.1 million in Q1FY27, compared to ₹890.2 million in the corresponding quarter of FY26. Total income, including other income of ₹21.6 million, reached ₹1,208.7 million. This compares to total income of ₹909.8 million in Q1FY26.
Total expenses for the consolidated entity were ₹1,001.6 million, up from ₹730.4 million in the prior year period. Key expense components included:
- Cost of materials consumed: ₹669.0 million (up from ₹475.2 million)
- Employee benefits expense: ₹204.5 million (up from ₹141.0 million)
- Other expenses: ₹120.3 million (up from ₹91.8 million)
Profit before tax was ₹213.9 million, against ₹184.1 million in Q1FY26. After accounting for tax expenses of ₹51.2 million (current tax ₹49.3 million and deferred tax ₹1.9 million), the group reported a profit after tax of ₹162.7 million.
Standalone Results
On a standalone basis, Tempsens Instruments recorded revenue from operations of ₹1,018.5 million, an increase of 21.9% from ₹835.6 million in Q1FY26. Total income including other income of ₹22.7 million was ₹1,041.2 million.
Standalone total expenses amounted to ₹868.6 million, comprising cost of materials consumed at ₹597.0 million and employee benefits expense of ₹160.5 million. Profit before tax was ₹172.5 million, leading to a profit after tax of ₹129.3 million after tax expenses of ₹43.2 million.
What the Numbers Show
The divergence between consolidated revenue growth (33.4%) and standalone revenue growth (21.9%) indicates that subsidiaries contributed disproportionately to the top-line expansion. Consolidated revenue exceeded standalone revenue by ₹168.6 million in Q1FY27, compared to ₹54.5 million in Q1FY26, suggesting increased activity or consolidation scope changes within the group structure.
Additionally, while revenue grew significantly, EBITDA margin contracted to 20.59% in Q1FY27 from 23.61% in Q1FY26. EBITDA stood at ₹245 million against ₹210 million in the prior year period. This margin compression suggests that input costs or operating expenses rose faster than top-line growth during the quarter.
IPO Context
Subsequent to the quarter ended June 30, 2026, the company completed its IPO of 21,666,666 equity shares at ₹300 per share, raising ₹6,500.0 million. The issue included an offer for sale of 18,500,000 shares by selling shareholders aggregating ₹5,550.9 million and a fresh issue of 3,166,666 shares aggregating ₹950.0 million. Shares were listed on NSE and BSE on August 28, 2026.
Walker Chandiok & Co LLP served as the statutory auditor, issuing a limited review report on the consolidated and standalone financial results. The operating segment is identified as "Industrial Products," with no separate segment disclosures presented.
Historical Stock Returns for Tempsens Instruments
| 1 Day | 5 Days | 1 Month | 6 Months | 1 Year | 5 Years |
|---|---|---|---|---|---|
| +3.23% | -5.39% | +80.18% | +80.18% | +80.18% | +80.18% |

How will Tempsens Instruments allocate the ₹950 million raised from the fresh IPO issue to drive future revenue growth and mitigate current margin compression?
What specific strategies will management implement to reverse the EBITDA margin contraction from 23.61% to 20.59% amidst rising material and employee costs?
Which subsidiaries or new business lines are driving the disproportionate 33.4% consolidated revenue growth compared to the 21.9% standalone growth?
 16
16




 Access Market Heat-map & Insights
  Create, Save & Share your Screener
  Use 200+ Screening Filters





