

Techera Engineering wins Rs 36.49978 lakh private order for aircraft tooling


- Techera Engineering won a new order worth Rs 36.49978 lakh from a private entity for aircraft sub-assembly tooling.
- The contract has a 3-4 month execution timeline and was disclosed on 16 September 2026.
- This marks the third order from a private domestic entity in Q2FY27, adding to wins from public sector and foreign clients.
- Total order inflow for Q2FY27 was previously reported as Rs 15573.86 crore across five orders.
- FY26 consolidated revenue stood at Rs 48.50 crore with a net profit of Rs 3.74 crore.


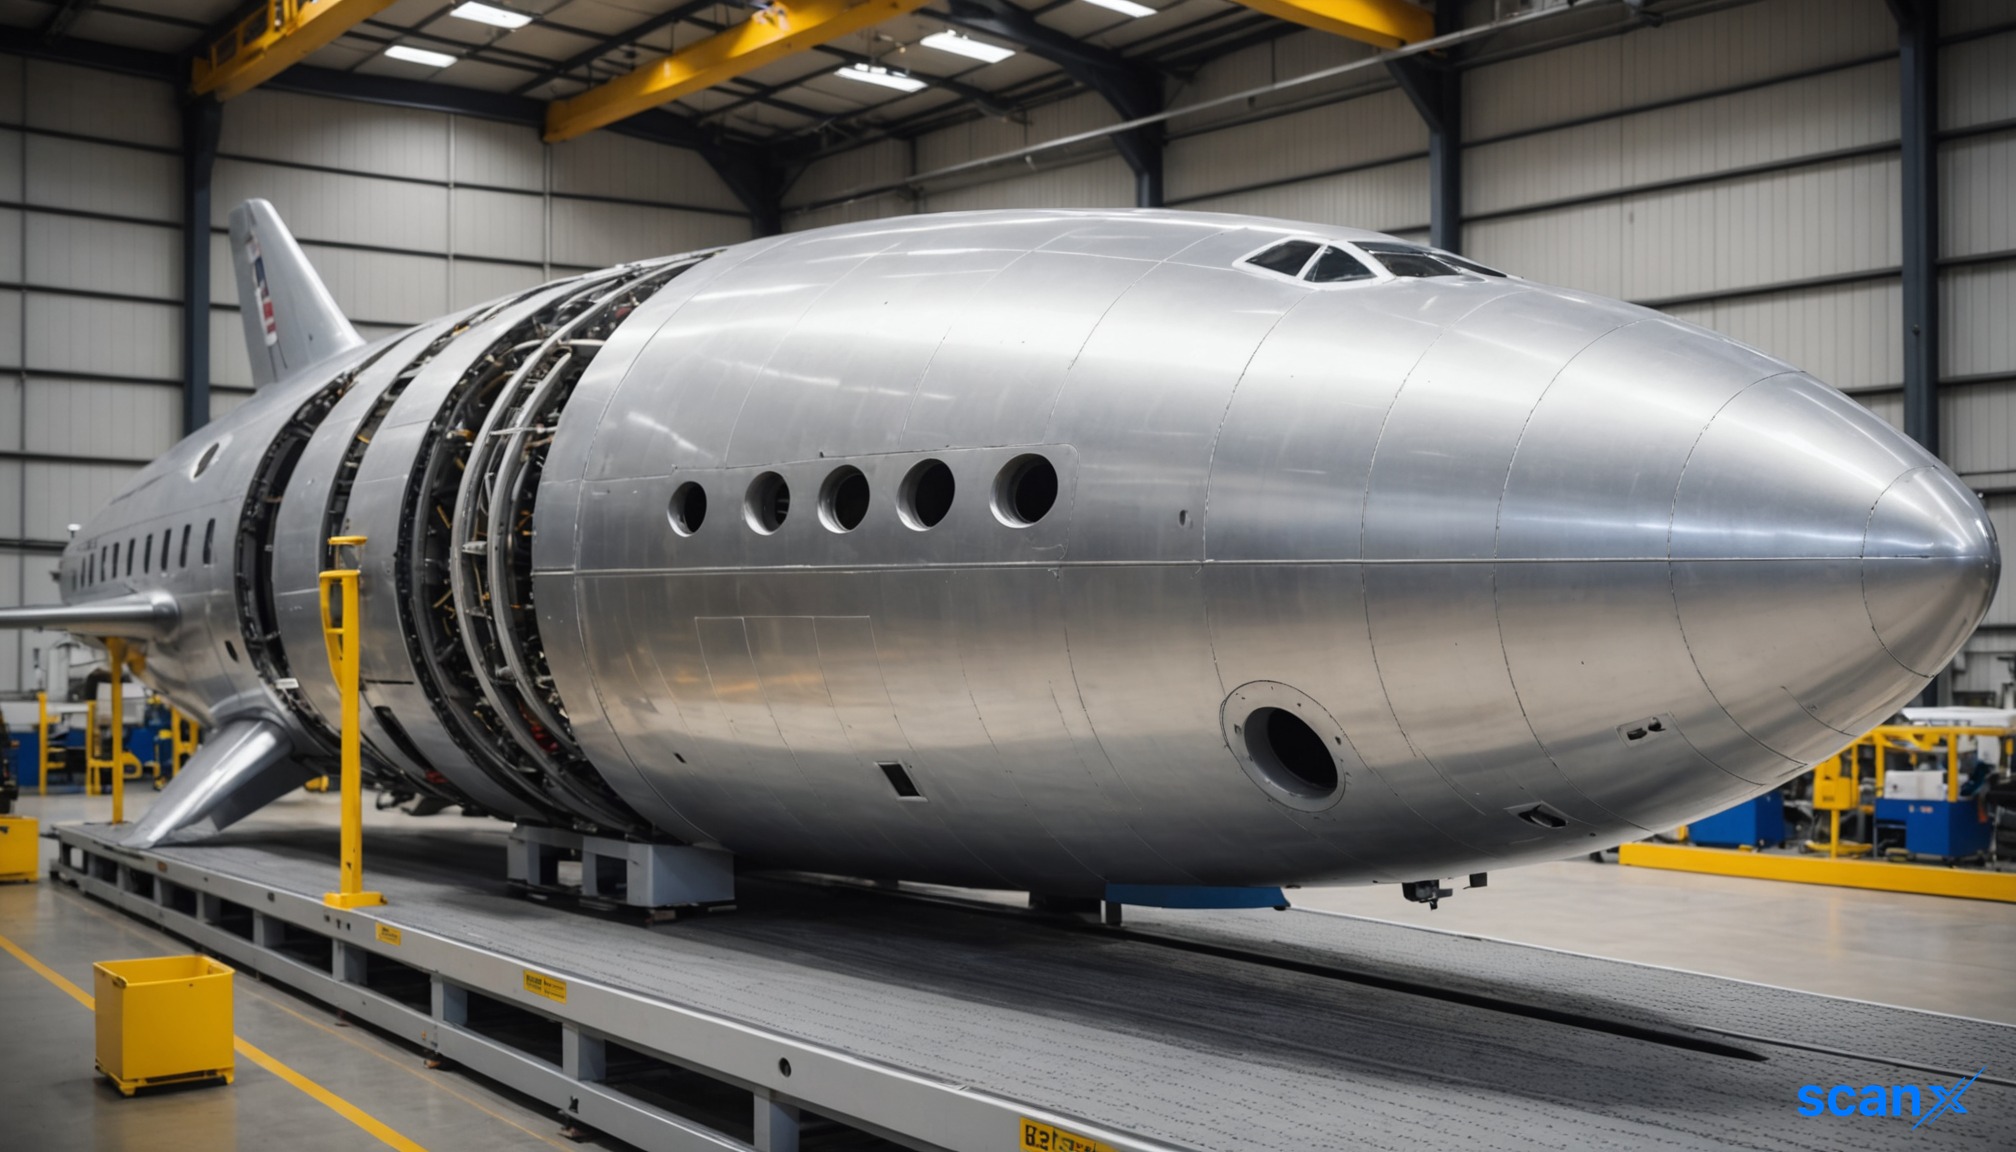
*this image is generated using AI for illustrative purposes only.
Techera Engineering has received an order valued at Rs 36.49978 lakh from a private entity for aircraft sub-assembly tooling. The contract carries a 3-4 month execution timeline and was dated 15 September 2026, disclosed to the exchange on 16 September 2026.
Order in Financial Context
This is the third order disclosed by Techera engineering from a private domestic entity in the current quarter. It complements previous wins from a foreign entity (Rs 15500.0) and public sector domestic entities (Rs 7.51 crore and Rs 5.00664 crore). With this latest disclosure, the company has now received orders from international, private domestic, and public sector domestic entity types in Q2FY27.
Company Order Track Record
Techera engineering has disclosed six orders in exchange filings over the last three fiscal quarters. The order history is detailed below:
| Date | Value | Awarding Entity | Terms |
|---|---|---|---|
| 2026-09-15 | Rs 36.49978 lakh | A Private Entity | Aircraft Sub-assembly Tooling |
| 2026-09-14 | Rs 7.51 crore | An Indian public sector aerospace and defense company | Insourcing of Structural Assembly Packages 04 LINES for Manufacturing of Rear Fuselage SEMFG1178; Insourcing for supply of structural assembly packages for manufacturing Air Intake LH & RH for LCAMk1A |
| 2026-08-30 | Rs 5.00664 crore | An Indian public sector aerospace and defense company | Insourcing of structural assembly & supply of HTT-40 Front Fuselage and Coupling |
| 2026-08-27 | Rs 15500.0 | A Foreign Entity | Aerospace Detail Part Tooling and Form Blocks |
| 2026-08-24 | Rs 1.4294045 crore | A Private Entity | Supply, Installation, Commissioning and Training of the Aircraft MRO equipment |
| 2026-08-18 | Rs 59.91744 lakh | A Private Entity | Aircraft Sub-assembly Tooling |
According to pre-computed data for Q2FY27 (Jul-Sep 2026), total order inflow was Rs 15573.86 crore across 5 orders prior to this filing. The quarterly summary reflects filings up to the data cut-off and may not yet incorporate the latest private entity order.
Execution and Revenue Quality
Techera engineering reported consolidated revenue of Rs 48.50 crore in FY26, reflecting a year-on-year decline of 2.8% from Rs 49.90 crore in FY25. Despite the revenue dip, net profit grew 10.0% to Rs 3.74 crore. The operating profit margin stood at 17.15% in FY26, compared to 17.38% in FY25.
| Period | Revenue (Rs Cr) | Net Profit (Rs Cr) | OPM (%) |
|---|---|---|---|
| FY26 | 48.50 | 3.74 | 17.15% |
| FY25 | 49.90 | 3.40 | 17.38% |
| FY24 | 39.00 | 2.80 | 17.74% |
Note: Quarterly breakdowns are not available in the input; annual figures are shown above.
Revenue Growth: Order Wins Translating to Revenue
Annual revenue declined from Rs 49.90 crore in FY25 to Rs 48.50 crore in FY26, representing a year-on-year change of -2.8% based on the latest annual data. Net profit growth remained positive at +10.0%, indicating that cost management has offset the slight revenue contraction.
Working Capital and Execution Capacity
The balance sheet indicates a current ratio of 1.40x, suggesting adequate short-term liquidity. Total liabilities/equity stands at 0.93x, which includes trade payables and other non-debt liabilities and is not solely interest-bearing debt. Operating cash flow was Rs 4.70 crore in FY25 against capex of Rs 36.90 crore, resulting in a free cash flow proxy of Rs -32.20 crore. This indicates that while operations generate cash, heavy capital expenditure requirements may strain working capital if not funded through external sources or retained earnings.
What to Watch
- Execution timeline: The new aircraft sub-assembly tooling order has a 3-4 month timeline, differing from the 5-year window of the earlier rear fuselage order, requiring distinct resource planning.
- Entity diversification: The addition of another private awarding entity alongside international and public sector entities broadens the disclosed order base in Q2FY27.
- Margin quality: Sustaining OPM above 17% as new contracts execute remains a key metric based on recent annual performance.
- Cash conversion: Operating cash flow trends should be monitored given the high capex cycle recorded in FY25.
Key Observations
- Valuation check (as of 16 Sep 2026): P/E of 97.9x against ROCE of 10.78%. P/E is price-derived and will change; ROCE is from audited financials.
- Cash conversion: Operating cashflow of Rs 4.70 crore in FY25 against capex of Rs 36.90 crore resulted in a free cash flow proxy of Rs -32.20 crore, indicating that the working capital cycle may be stretched.
- Private sector order: The order from the private entity is classified as a non-related-party transaction with no promoter interest disclosed.

 18
18










 Access 50+ Readymade Screeners
  Use 200+ Custom Filters
  Get Full Market Insights





