

TeamLease Services posts 38% PAT surge in Q1FY27 on specialized staffing strength


TeamLease Services delivered strong Q1FY27 financials with a 38% YoY increase in PAT to ₹34 crore and 6% revenue growth to ₹3,056 crore. Despite a sequential EBITDA dip due to seasonality, business EBITDA rose 18%. Key developments include a completed ₹238 crore buyback, divestment of Crystal HR stake, and continued growth in specialized staffing led by GCCs and AI talent demand.

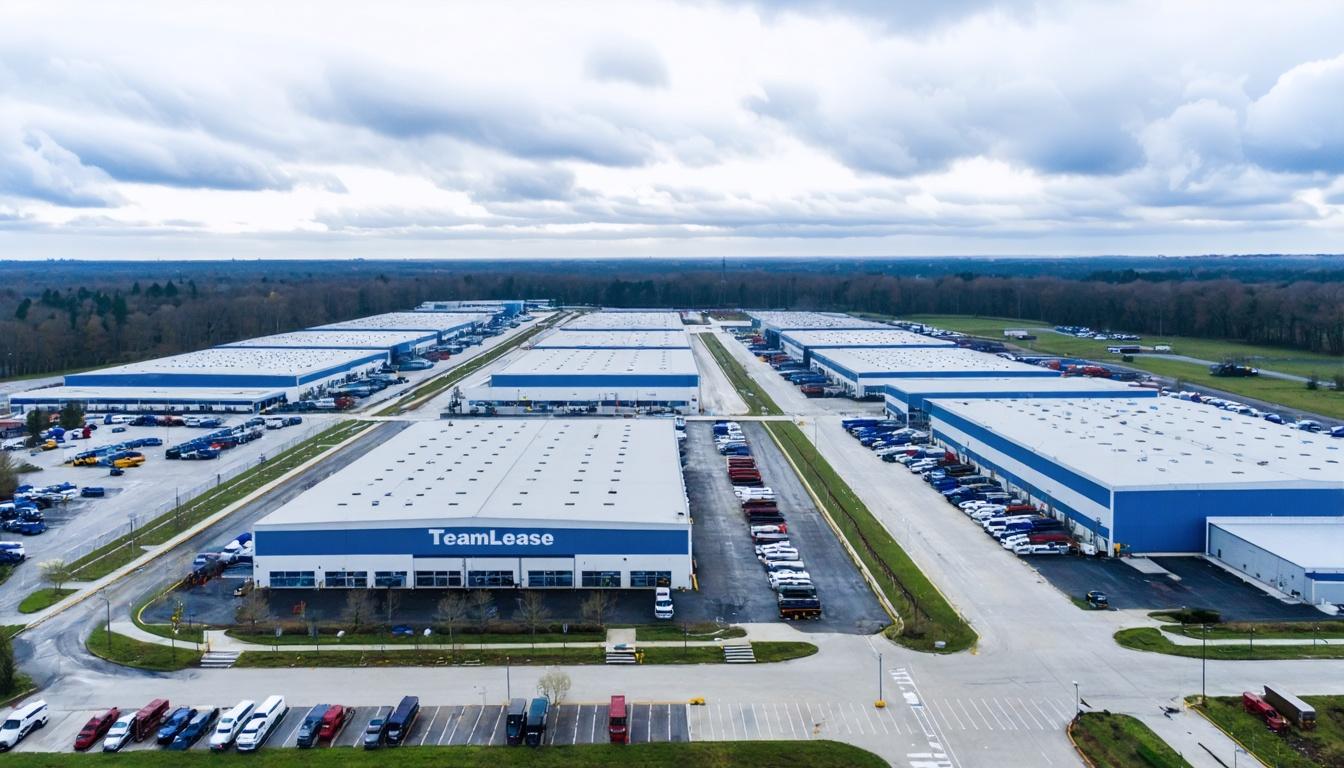

*this image is generated using AI for illustrative purposes only.
TeamLease Services Limited reported a robust start to fiscal year 2027, with consolidated revenue rising 6% year-on-year (YoY) to ₹3,056 crore in the first quarter ended September 2026. Profit before tax (PBT) and profit after tax (PAT) both surged 38% YoY, reaching ₹36 crore and ₹34 crore respectively. This profitability expansion occurred despite a 31% sequential decline in EBITDA, which management attributed primarily to EdTech seasonality and annual appraisal cycles. The results highlight a strategic shift towards higher-margin specialized staffing and global capability centers (GCCs), which now drive significant incremental demand.
The earnings call, hosted on July 29, 2026, and transcribed pursuant to Regulation 30 of the SEBI LODR Regulations, 2015, revealed that business EBITDA—excluding corporate costs—grew 18% YoY. Managing Director Suparna Mitra noted that structural tailwinds, including the implementation of four new labor codes and the rise of GCCs, favor organized players. GCCs now account for 45% of the specialized staffing associate base and 67% of its net revenue. Additionally, the company completed a ₹238 crore share buyback, representing 8.8% of pre-buyback paid-up capital, funded entirely from internal accruals.
Segment Performance and Operational Metrics
General staffing closed the quarter with approximately 2.91 lakh associates, a sequential net addition of 4,000. While gross hiring was the highest in three quarters, growth was tempered by deferred manpower additions due to cost pressures from elevated crude and freight costs. Over 65% of new client logos in general staffing were secured under variable markup or outcome-linked pricing, a model designed to protect margins during demand softness. Specialized staffing saw a net addition of 130 associates, closing at 7,630, with AI/ML and cloud skills leading demand. The company added 40 new logos in this segment, including 15 GCCs.
| Metric | Q1FY27 Value | YoY Change | Sequential Change |
|---|---|---|---|
| Consolidated Revenue | ₹3,056 crore | +6% | +4% |
| EBITDA | Not disclosed | +3% | -31% |
| Business EBITDA | Not disclosed | +18% | N/A |
| PBT | ₹36 crore | +38% | N/A |
| PAT | ₹34 crore | +38% | N/A |
| Associate Count (General) | 2.91 lakh | N/A | +4,000 |
Financial Health and Capital Allocation
CFO Ramani Dathi highlighted strong cash generation, with operating cash flow converting at 100% of EBITDA. The company ended the quarter with net free cash of ₹350 crore, aided by a ₹38 crore tax refund. Days Sales Outstanding (DSO) for staffing remained stable at 6 days, with funding exposure at 16%. In a move to rationalize its portfolio, the Board directed the exercise of a put option in Crystal HR, divesting a 30% stake with full recovery of the original investment cost. TDS receivables stand at approximately ₹145 crore, with active pursuit ongoing.
What the Numbers Show
The divergence between the 18% growth in business EBITDA and the 3% growth in group EBITDA signals increased unallocated corporate costs, primarily driven by new leadership hires in technology and management. However, the core operational engine remains healthy. The strategic pivot towards variable markup contracts in general staffing and high-value AI roles in specialized staffing suggests a deliberate effort to enhance margin resilience against macroeconomic volatility. With EdTech margins expected to stabilize at 8-10% and RegTech contributing meaningfully, the portfolio mix is gradually shifting towards higher-margin adjacencies, potentially supporting long-term margin expansion beyond the current 1.2-1.3% steady state.
Historical Stock Returns for Teamlease Services
| 1 Day | 5 Days | 1 Month | 6 Months | 1 Year | 5 Years |
|---|---|---|---|---|---|
| +2.68% | -1.39% | -7.33% | +4.51% | -33.76% | -73.72% |

How might the full implementation of the four new labor codes impact TeamLease's competitive advantage over unorganized staffing players in FY27?
What specific strategies is management deploying to mitigate the margin pressure from elevated crude and freight costs in the general staffing segment?
Will the company consider further capital allocation initiatives, such as dividends or additional buybacks, given its ₹350 crore net free cash position?
 15
15










 Access Market Heat-map & Insights
  Create, Save & Share your Screener
  Use 200+ Screening Filters





