

Sun Pharma FY26 Results: Net profit up 5% YoY to ₹11,479 crore


- Net profit for FY26 rose 5% YoY to ₹11,479 crore
- Gross sales grew 12% YoY to ₹58,220 crore
- EBITDA margin expanded to 30.3% from 29.0% in FY25
- India formulations contributed 33% to total revenue, while US formulations accounted for 29%
- Net cash position strengthened to ₹30,140 crore



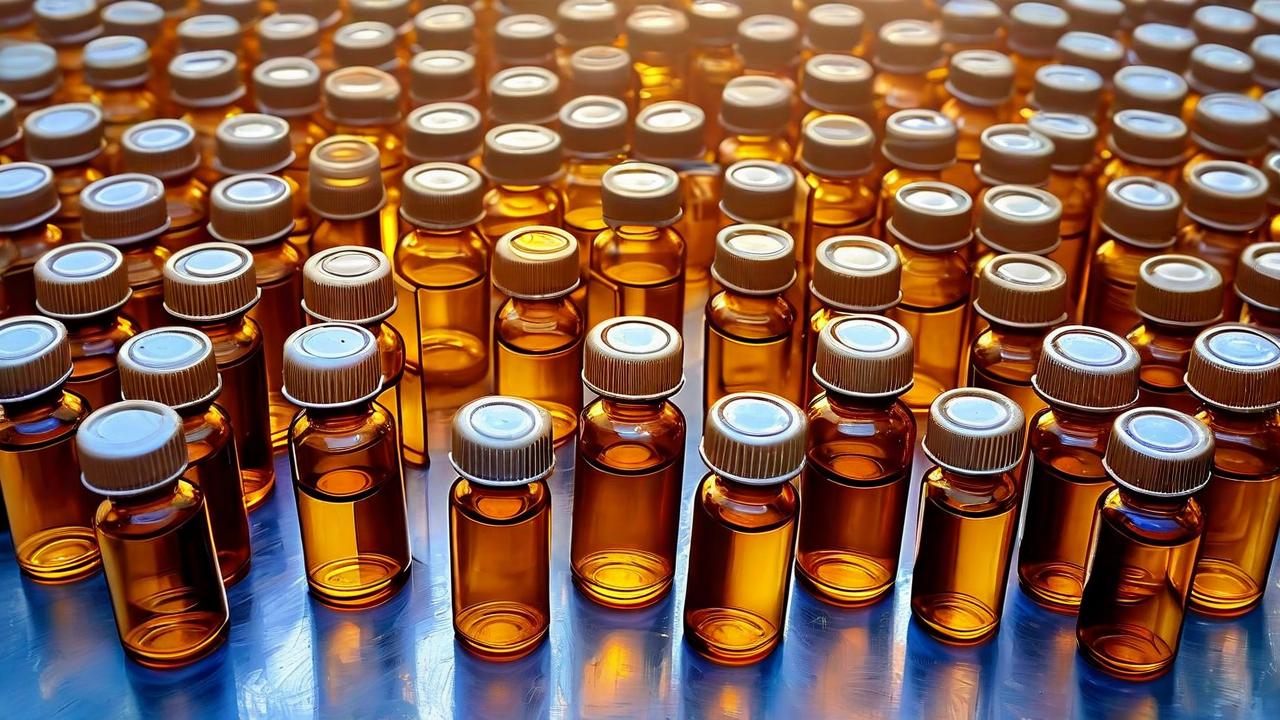
*this image is generated using AI for illustrative purposes only.
Sun Pharmaceutical Industries Limited reported a net profit of ₹11,479 crore for FY26, marking a 5% increase year-on-year. The pharmaceutical major logged gross sales of ₹58,220 crore, reflecting a 12% growth compared to the previous fiscal year.
The company’s operational performance remained robust, with EBITDA rising 16% YoY to ₹17,731 crore. This expansion was supported by improved profitability metrics, as the EBITDA margin widened to 30.3% in FY26 from 29.0% in FY25. Gross margins also saw a steady upward trajectory, reaching 80.2% in FY26.
Segment-wise Revenue Performance
The revenue mix highlights the company's diversified global footprint, with international markets contributing significantly to the top line. India formulations remain the largest segment by contribution, followed closely by US formulations.
| Segment | FY26 Sales (₹ crore) | Share of Total |
|---|---|---|
| India Formulations | 19,290 | 33% |
| US Formulations | 16,824 | 29% |
| Emerging Markets | 11,187 | 19% |
| Rest of World | 8,568 | 15% |
| API & Others | 2,400 | 4% |
Emerging Markets demonstrated strong momentum with sales growing 19% YoY to ₹11,187 crore. The Rest of World segment also posted healthy growth, with revenues expanding 19% YoY to ₹8,568 crore. In contrast, US Formulations grew at a moderate pace of 3.6% YoY, reaching ₹16,824 crore.
What the Numbers Show
A divergence is visible between the robust double-digit revenue growth and the single-digit net profit expansion. While top-line figures expanded 12%, net profit grew only 5%. This gap is largely attributable to exceptional items disclosed in the financial notes. The adjusted net profit, which excludes these non-recurring provisions, stood at ₹12,402 crore, showing a more modest 3% increase. The reported profit includes adjustments for items such as GxMDL provisions and wage code impacts, which weighed on the bottom line despite strong operational cash flows.
Balance Sheet and Cash Flow Strength
Sun Pharma maintained a strong balance sheet position, characterized by significant cash reserves and low leverage. Net cash (excluding debt) increased to ₹30,140 crore in FY26 from ₹26,790 crore in FY25. The company’s cash and bank balances stood at ₹11,603 crore as of March 31, 2026.
Operating cash flow remained healthy, with net cash from operating activities at ₹12,420 crore for FY26. Free cash flow was recorded at ₹8,810 crore, indicating ample liquidity for future investments and shareholder returns.
R&D and Manufacturing Footprint
The company continues to prioritize innovation, with R&D spending accounting for 6.1% of sales in FY26. Cumulative R&D spend has reached approximately ₹34,500 crore to date. The innovative medicines portfolio now contributes 22% of total sales, up from 7.3% in FY18, signaling a strategic shift toward higher-value products.
Manufacturing capabilities span 40 facilities globally, supporting operations in over 100 countries. The company employs over 47,000 people worldwide and maintains a leadership position in the Indian pharmaceutical market with an 8.5% market share.
Historical Stock Returns for Sun Pharmaceutical
| 1 Day | 5 Days | 1 Month | 6 Months | 1 Year | 5 Years |
|---|---|---|---|---|---|
| -1.37% | -3.20% | -5.09% | +5.70% | +4.68% | +107.28% |

How will the widening gap between 12% revenue growth and 5% net profit growth influence investor sentiment and valuation multiples for Sun Pharma in the upcoming quarters?
What specific strategic initiatives is Sun Pharma planning to accelerate US formulation growth beyond the current 3.6% YoY rate to match the momentum seen in Emerging Markets?
With net cash reserves exceeding ₹30,000 crore, how might Sun Pharma deploy this liquidity through acquisitions, R&D expansion, or enhanced shareholder returns in FY27?
 19
19








 Create Custom Screeners
  Access 200+ Pre-built Filters
  Use 50+ Readymade Screener





