

Steel Strips Wheels reports 36.84% YoY growth in June 2026 net turnover


Steel Strips Wheels Limited reported a 36.84% year-on-year increase in net turnover to ₹479.87 Cr for June 2026, driven by strong performance in the Truck, Tractor, and 2 & 3 Wheeler segments. The company also saw a 7% recovery in export value growth despite a volume decline, signaling improved realizations.


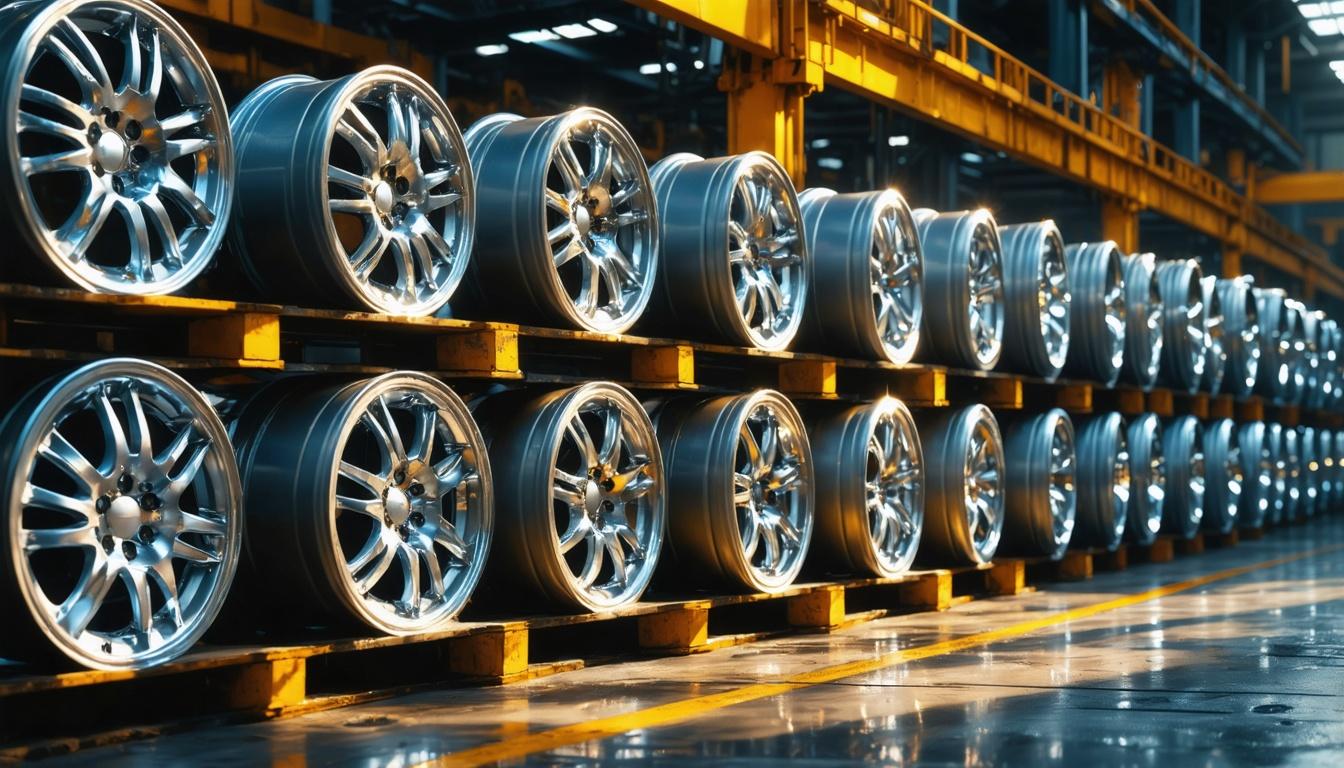
*this image is generated using AI for illustrative purposes only.
Steel Strips Wheels Limited reported a 36.84% year-on-year increase in net turnover to ₹479.87 Cr for June 2026, compared to ₹350.67 Cr in the same period last year. The company achieved a gross turnover of ₹554.10 Cr, a 29.98% increase from the ₹426.31 Cr recorded in June 2025. This performance highlights a significant recovery in export values and robust demand across the commercial and agricultural vehicle sectors.
Segment-wise Performance
The Truck segment emerged as a primary growth driver, posting a 54% increase in value and a 39% rise in volume year-on-year, reflecting robust freight demand and a firming commercial vehicle replacement cycle. The Tractor segment demonstrated resilience with 34% value growth and 27% volume growth, supported by healthy rural cash flows and sustained farm mechanization demand.
The 2 & 3 Wheelers segment recorded the highest value growth at 74%, with volumes increasing by 40%, indicating a sharp pivot toward higher-margin products linked to Electric Vehicle adoption. The Alloy Wheels segment showed steady premiumization with 35% value growth and 21% volume growth, while Passenger Cars maintained a stable trajectory with 9% value growth and 11% volume growth.
Exports delivered a notable inflection, registering a 7% positive growth by value year-on-year despite a 39% decline in volume due to international logistics constraints. This marks the first meaningful value-side recovery in exports for the company in a long time, driven by strategic pricing and a shift toward premium configurations.
Segment-wise Sales Performance (June 2026)
The following table summarizes the year-on-year growth across all key segments for June 2026:
| Segment | June-26 Growth (by Value) (YoY) | June-26 Growth (by Volume) (YoY) |
|---|---|---|
| 2 & 3 Wheelers (incl. EV) | 74% | 40% |
| Truck | 54% | 39% |
| Alloy Segment | 35% | 21% |
| Tractor | 34% | 27% |
| Passenger Car | 9% | 11% |
| Exports | 7% | -39% |
| Overall Business | 37% | 23% |
Historical Stock Returns for Steel Strips Wheels
| 1 Day | 5 Days | 1 Month | 6 Months | 1 Year | 5 Years |
|---|---|---|---|---|---|
| +3.80% | +1.85% | +23.33% | +94.67% | +96.61% | 0.0% |

Can the 2 & 3 Wheeler segment sustain its 74% value growth as the EV adoption curve matures?
Will the export volume decline of 39% reverse as international logistics constraints ease?
Is the current surge in Truck demand driven by a temporary replacement cycle or a long-term freight trend?
 18
18










 Access Market Heat-map & Insights
  Create, Save & Share your Screener
  Use 200+ Screening Filters





